Governments and Global Credit Markets: Two Centuries of Evidence
When private capital markets freeze during wars and financial crises, who keeps cross-border credit flowing? Often, it is governments themselves. In States as Financiers: International Lending in War and Peace (NBER Working Paper 35225), Sebastian Horn, Carmen M. Reinhart, and Christoph Trebesch construct and analyze the most comprehensive historical record of official cross-border lending assembled to date.
When private capital retreats during wars and financial crises, governments often step in with large-scale, heavily subsidized cross-border loans.
The researchers create three new datasets. The first, the International Official Lending Database, traces more than 1.2 million individual loans, grants, and guarantees extended by 134 bilateral creditor governments and 70 multilateral institutions to over 200 debtor countries from 1790 to 2024, totaling more than $20 trillion in 2020 dollars. The second dataset covers outstanding external public debt decomposed by creditor type for up to 140 economies from 1910 to 2024. The third compiles instrument-level private capital flow data around 36 major global financial crises and 35 great power war episodes.
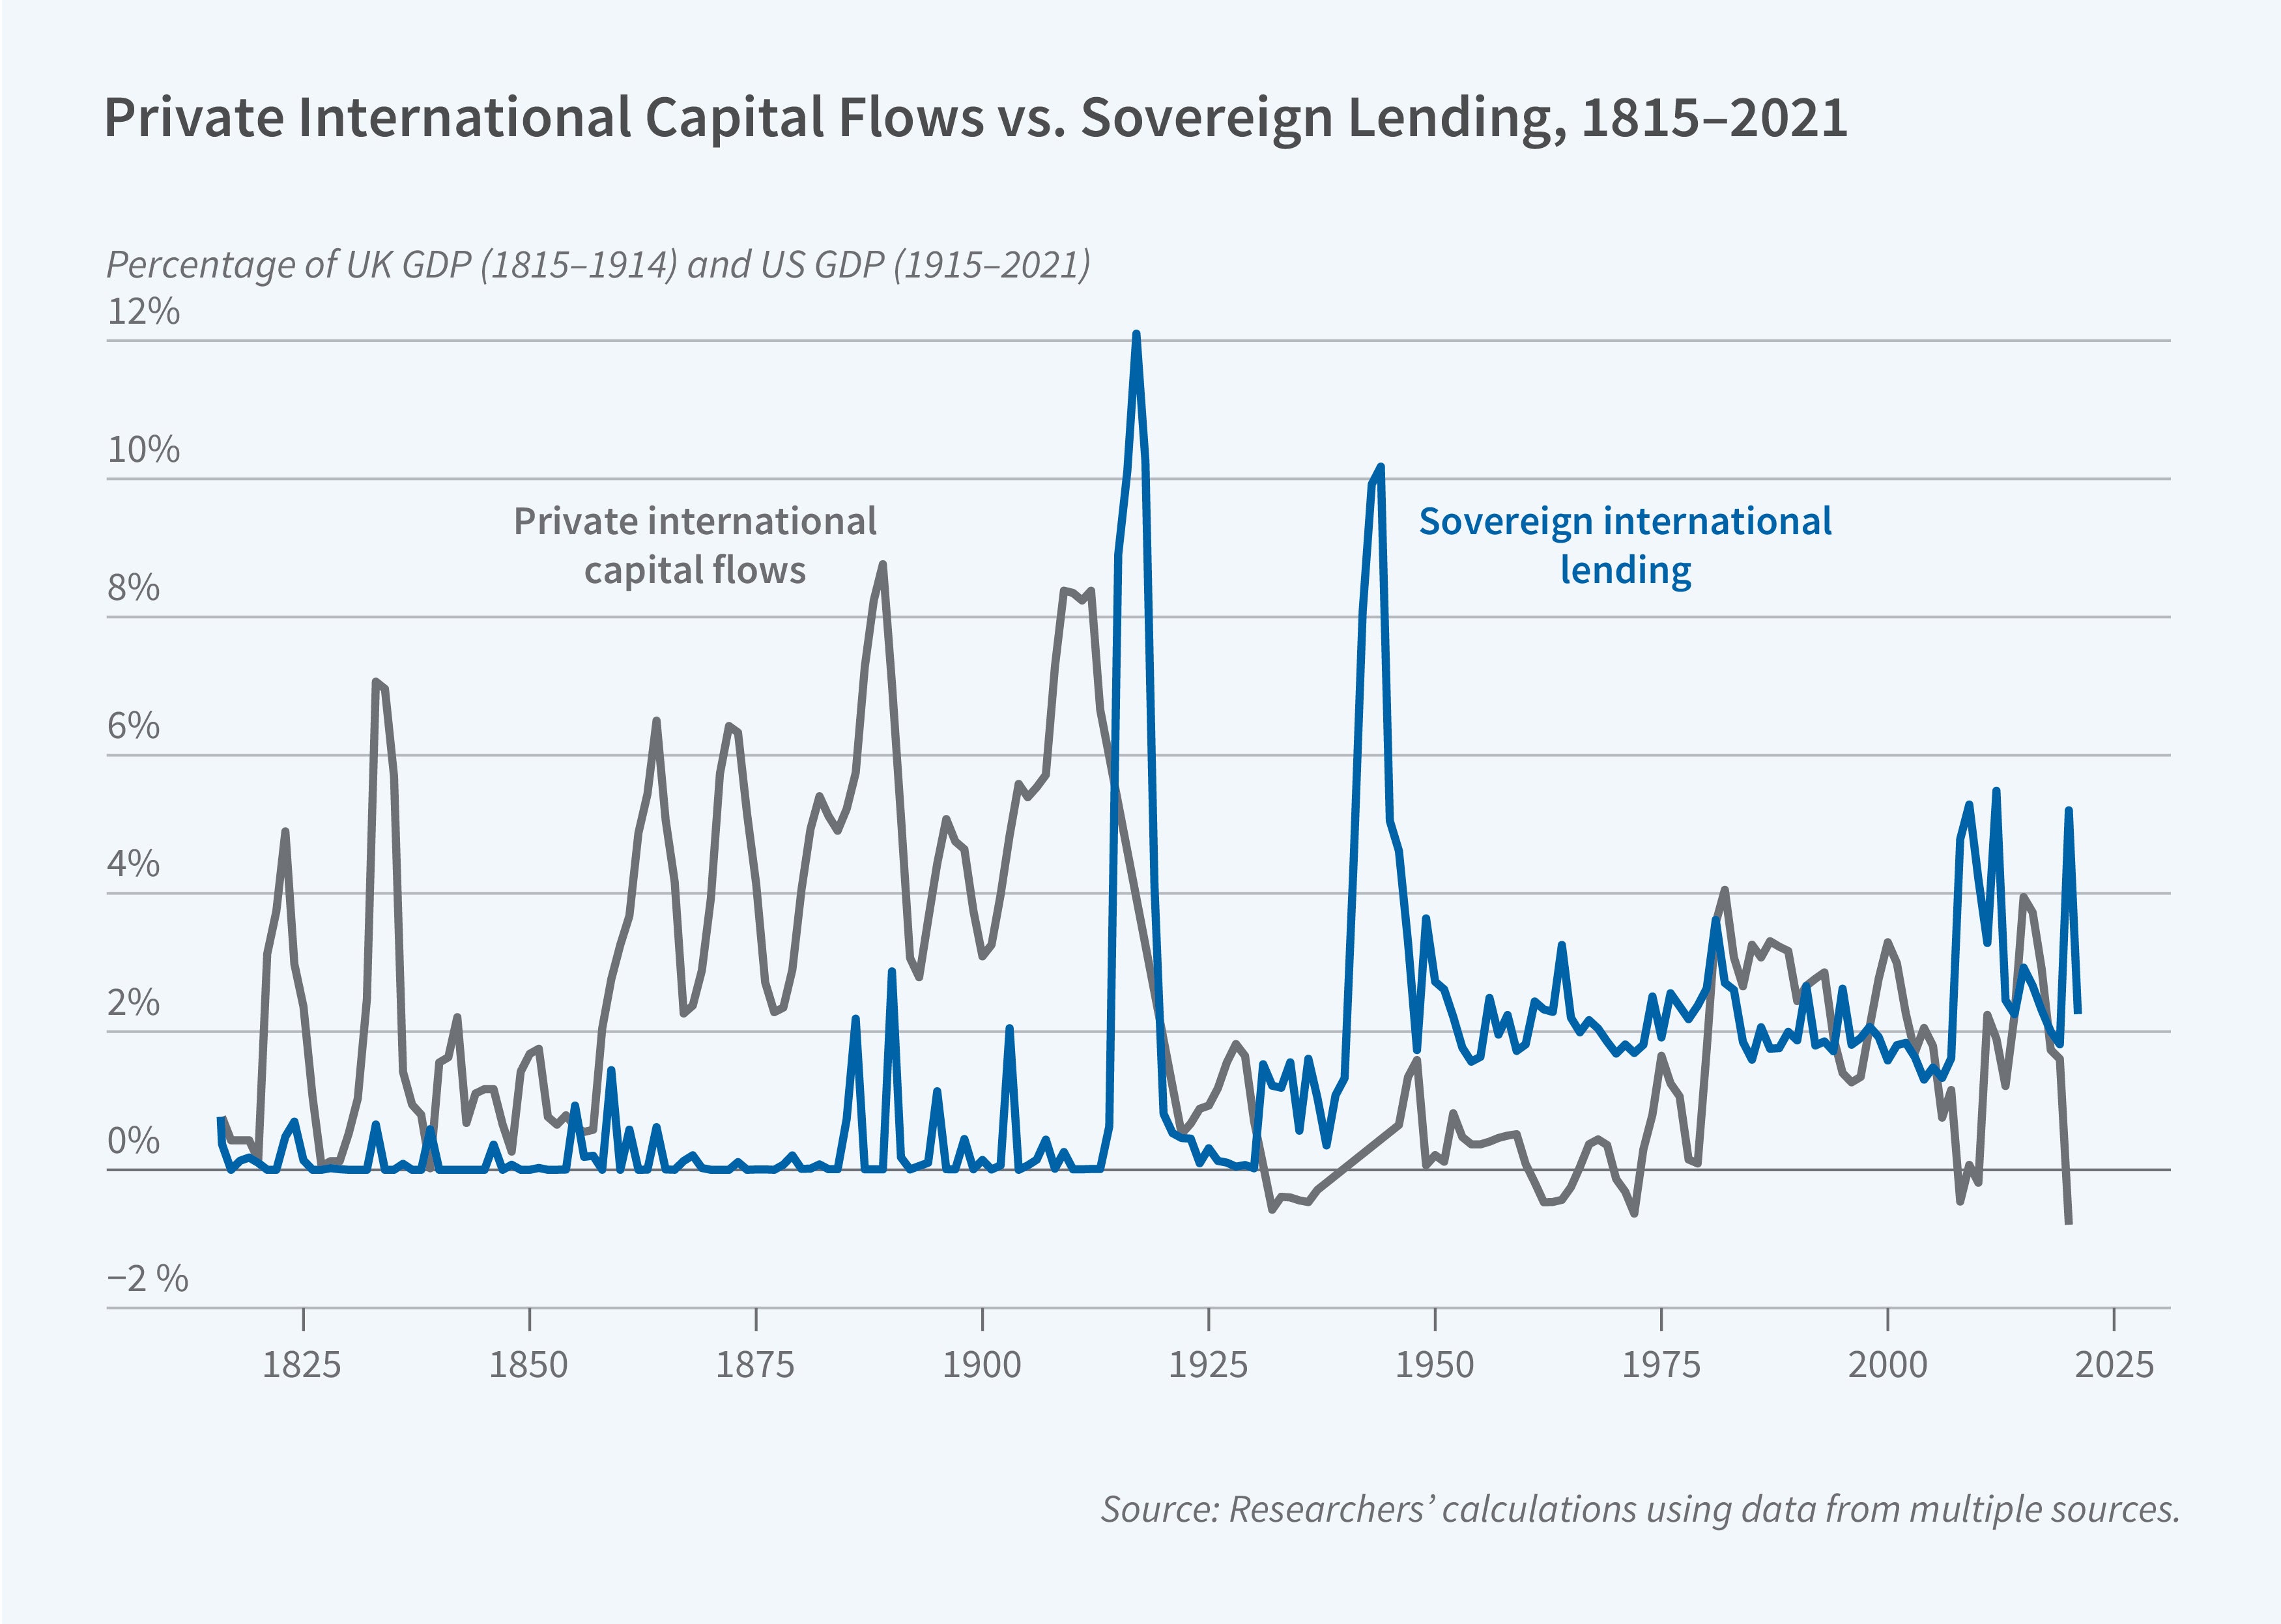
The researchers find that official international lending is far more substantial than commonly recognized. Aggregate official flows repeatedly matched or exceeded private cross-border flows. Scaled to the GDP of the leading creditor nation, which was the United Kingdom until 1914 and the United States thereafter, these flows surpassed 10 percent of GDP in 1916 and 1942. Between 1910 and 2020, official creditors accounted for between 30 and 60 percent of total external public debt worldwide. In the average developing country today, approximately 60 percent of external public debt is owed to bilateral and multilateral official creditors.
The data also show that private capital flows are procyclical, contracting during crises and wars, while official flows exhibit statistically significant positive correlations with financial crises, macroeconomic disasters, geopolitical risk, and interstate war. During great power wars, official flows to belligerent countries exceeded private flows by a factor of 10 or more on average. The probability of a crisis- or war-affected country receiving at least one official loan or grant rose from roughly 20 percent in the nineteenth century to essentially 100 percent in the post-World War II period, and the average bailout size nearly doubled from 65 percent of recipient-country imports in the nineteenth century to more than 100 percent in recent decades.
Official and private credit also differ sharply in pricing. Private external lenders charge average spreads of 177 basis points above the US risk-free rate, and those spreads rise with borrower credit risk. Official creditors lend at average spreads of -305 basis points, and their pricing is largely insensitive to borrower creditworthiness; lower-rated sovereigns borrow more cheaply from official creditors than higher-rated sovereigns. The same divergence extends to maturities: Higher-risk borrowers face shorter maturities from private creditors but longer ones from official creditors.
As to the drivers of official bilateral lending, the researchers estimate that a 1 percent increase in bilateral trade exposure is associated with approximately a 0.4 percent increase in official financial flows. This relationship is relatively stable across the pre- and post-World War II periods. Allied country pairs receive more than twice the volume of bilateral loans and grants as non-allied pairs. The dominant drivers shift by shock type: During wars, military alliances are the primary predictor of lending, with official flows to wartime allies running roughly 175 percent above those to non-allies. During financial crises, trade linkages become the more important driver while the alliance interaction is not statistically significant. These results are consistent with creditor governments acting to protect domestic banks and exporters during financial stress and supporting military partners during conflict.
Christoph Trebesch acknowledges support from the European Union (ERC, Great.Power.Finance, 101087838).