Global Externalities of US Government R&D
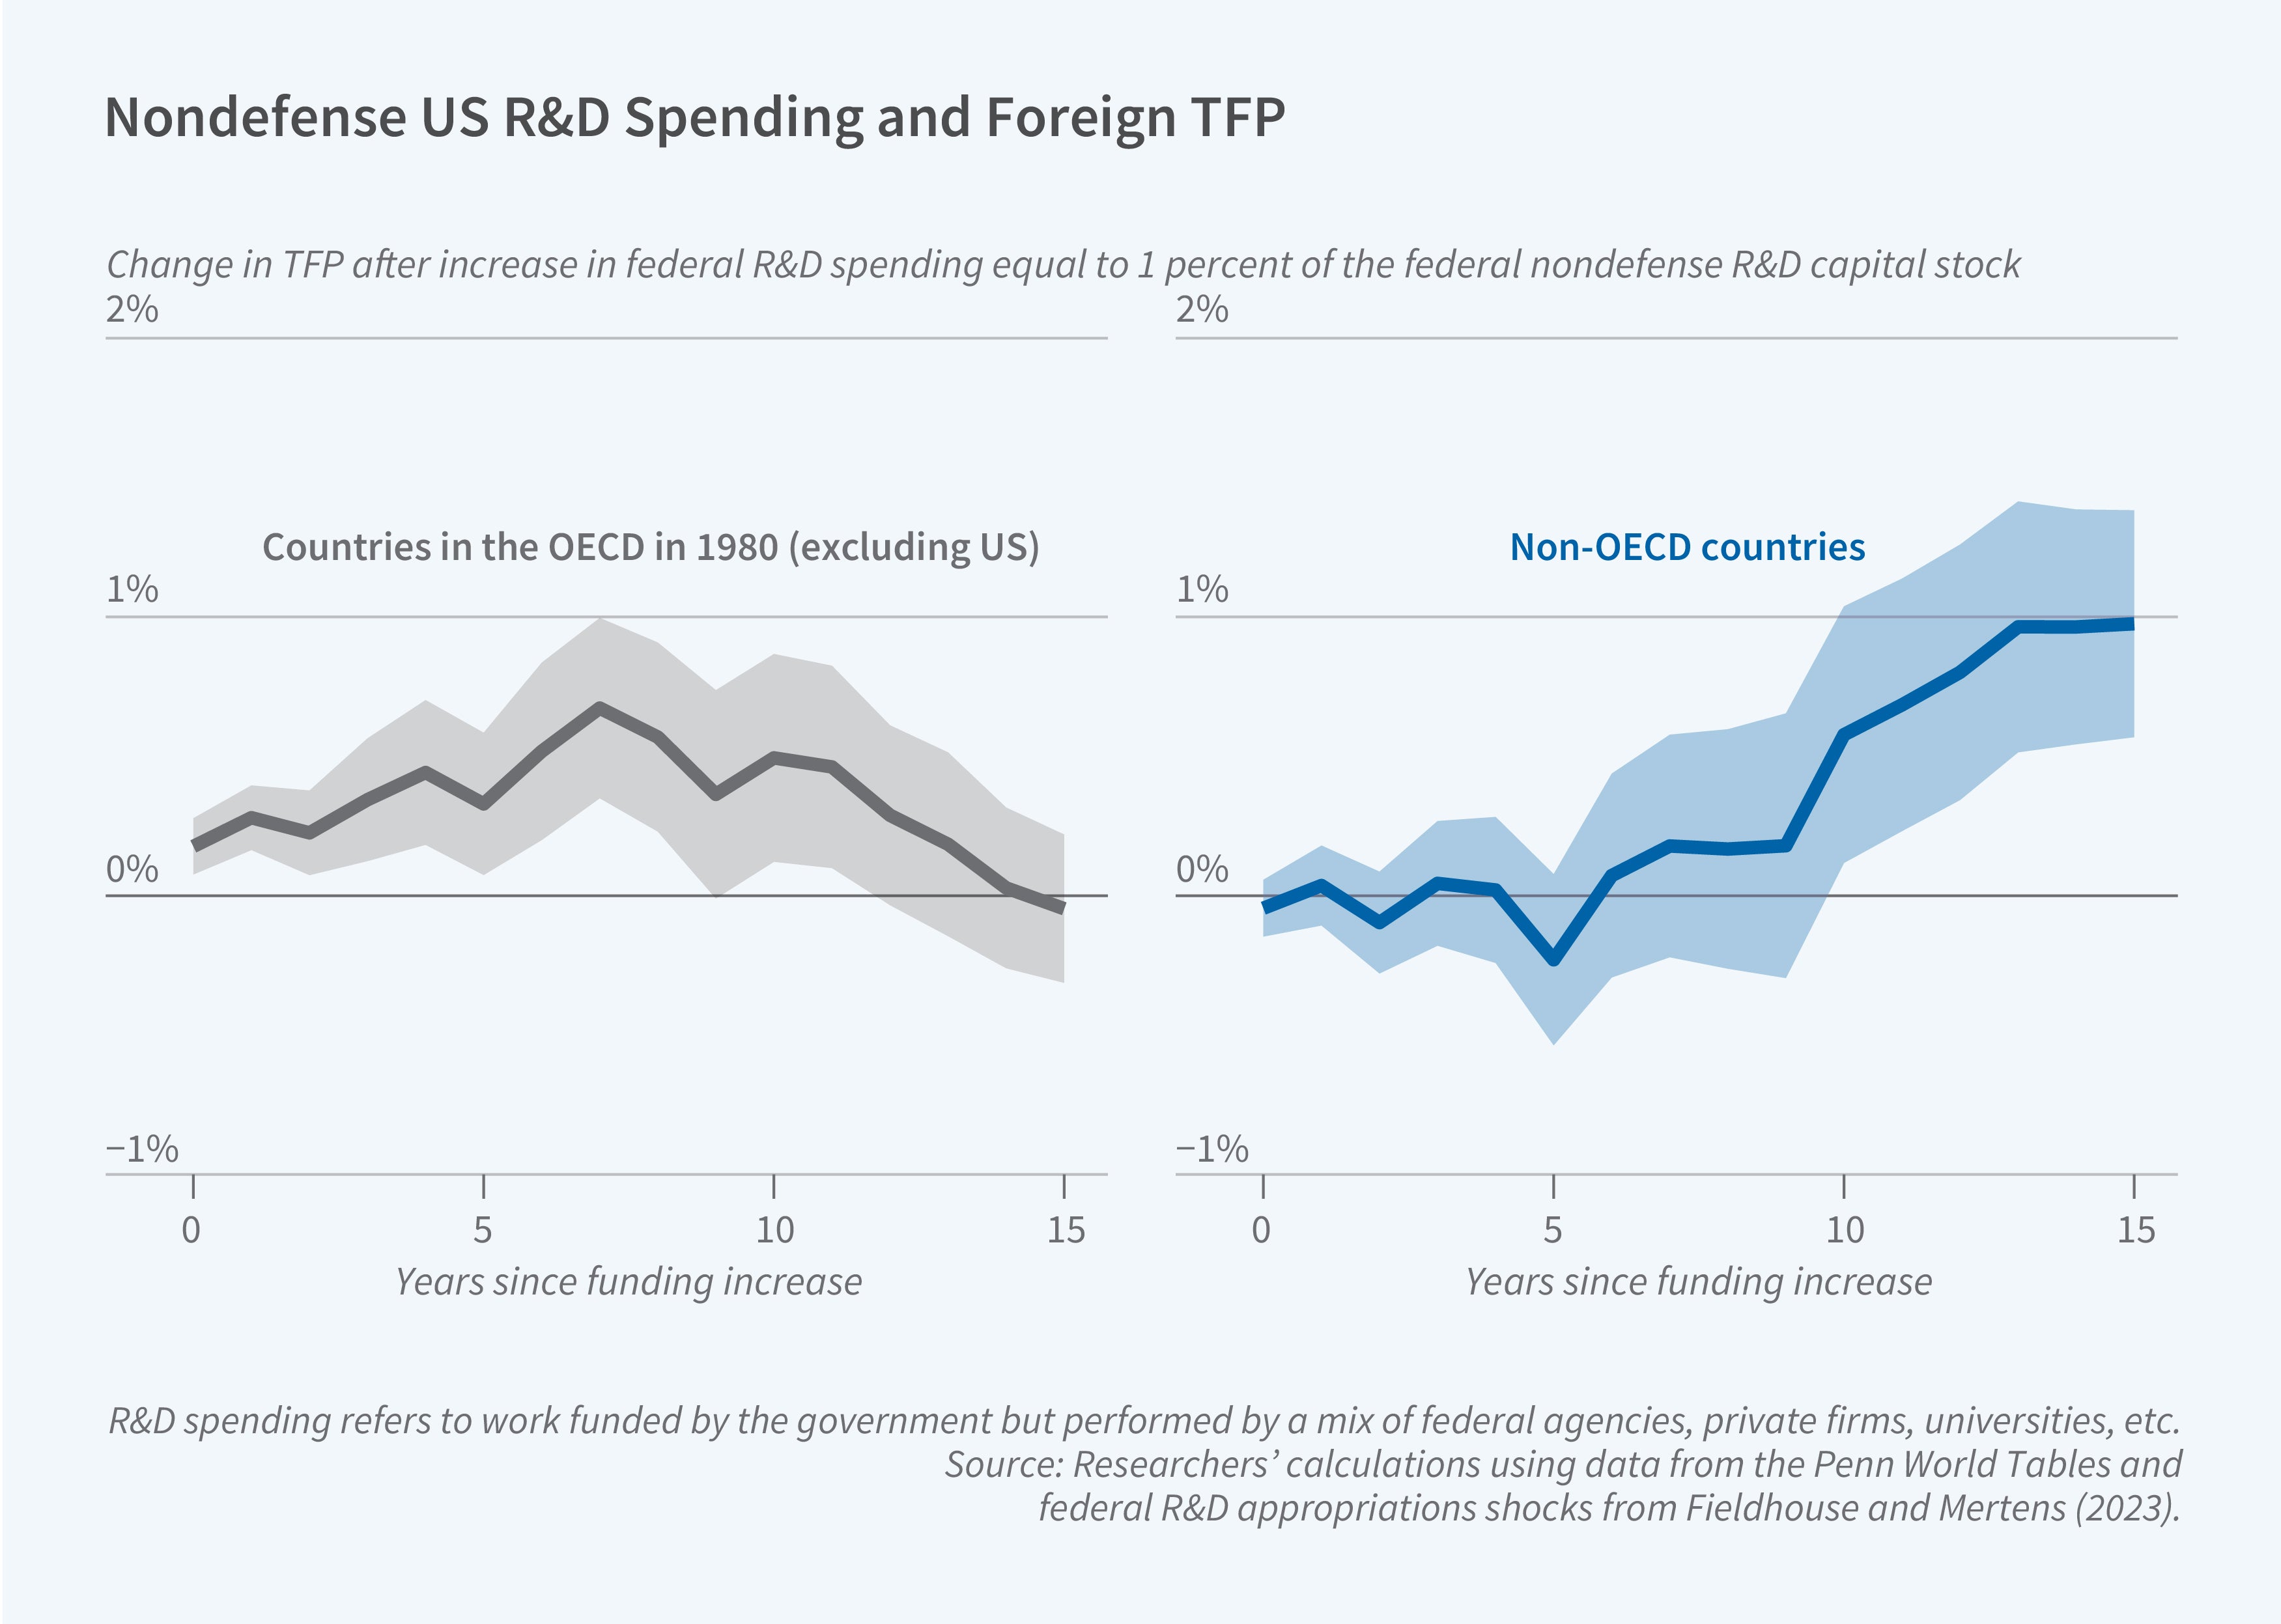
Models of global growth emphasize cross-country knowledge spillovers to explain why countries with very different levels of innovation can nonetheless grow at similar long-run rates. Yet the size of these spillovers has mostly been inferred indirectly. In The Effects of US Public R&D on Global Growth (NBER Working Paper 35517), Gustavo De Souza, Andrew J. Fieldhouse, Karel Mertens, Ishan B. Nath, and Valerie A. Ramey provide new estimates of how US government research spending affects productivity in other countries.
In earlier work, two of the authors identified “surprise” changes in federal research and development (R&D) appropriations—funding shifts driven by factors unrelated to the ebbs and flows of the economy—for the five agencies that account for most US research spending: the Departments of Defense and Energy, NASA, the National Institutes of Health, and the National Science Foundation. In the new study, the researchers trace how these appropriations shocks affect total factor productivity (TFP) in 69 other countries over 1980–2019. Data on country productivity come primarily from the Penn World Tables. The analysis then separates the effects of nondefense research, such as basic science and health research, from those of defense research, and distinguishes results for a disaggregated sample of 23 established OECD economies from those for 40 countries that never joined the OECD.
A US R&D appropriations shock equal to 1 percent of the federal R&D capital stock raises foreign productivity by approximately 1 percent after 12 years. This effect is driven mainly by nondefense rather than defense research. Each shock is scaled to 1 percent of its own capital stock, and on that basis nondefense R&D shocks produce a larger peak response (0.6 percent) than defense R&D shocks (0.4 percent) and are far more persistent.
The productivity gains are heavily concentrated among non-OECD countries. Their measured productivity response peaks at roughly 1.8 percent, about three times the roughly 0.5 percent peak effect among OECD countries, whose gains fade to zero at longer time horizons. Countries with smaller existing stocks of research capital tend to show larger productivity responses, both across the two groups and among OECD countries—a pattern that runs counter to the idea that countries need substantial existing research capacity to absorb new technology from abroad. These patterns are more consistent with diffusion through openly published scientific findings, the transfer of technology embedded in traded capital goods, and “leapfrogging,” in which countries without established older technology can adopt newer innovations more readily.
The researchers do not find any evidence that increased US public R&D crowds out foreign research activity. If anything, US R&D appropriations shocks are associated with modest increases in foreign private-sector and higher-education R&D investment, suggesting a complementary rather than competitive relationship between US and foreign research efforts.
Combining the estimated foreign and domestic productivity responses, weighted by each country group’s economic output, the researchers calculate that the global social returns to US public nondefense R&D are roughly twice as large as the domestic returns alone. This implies the United States captures, at most, about half of the total productivity benefits generated by its own public nondefense research investments.