Regulatory Limits on the Concentration of Mutual Fund Portfolios
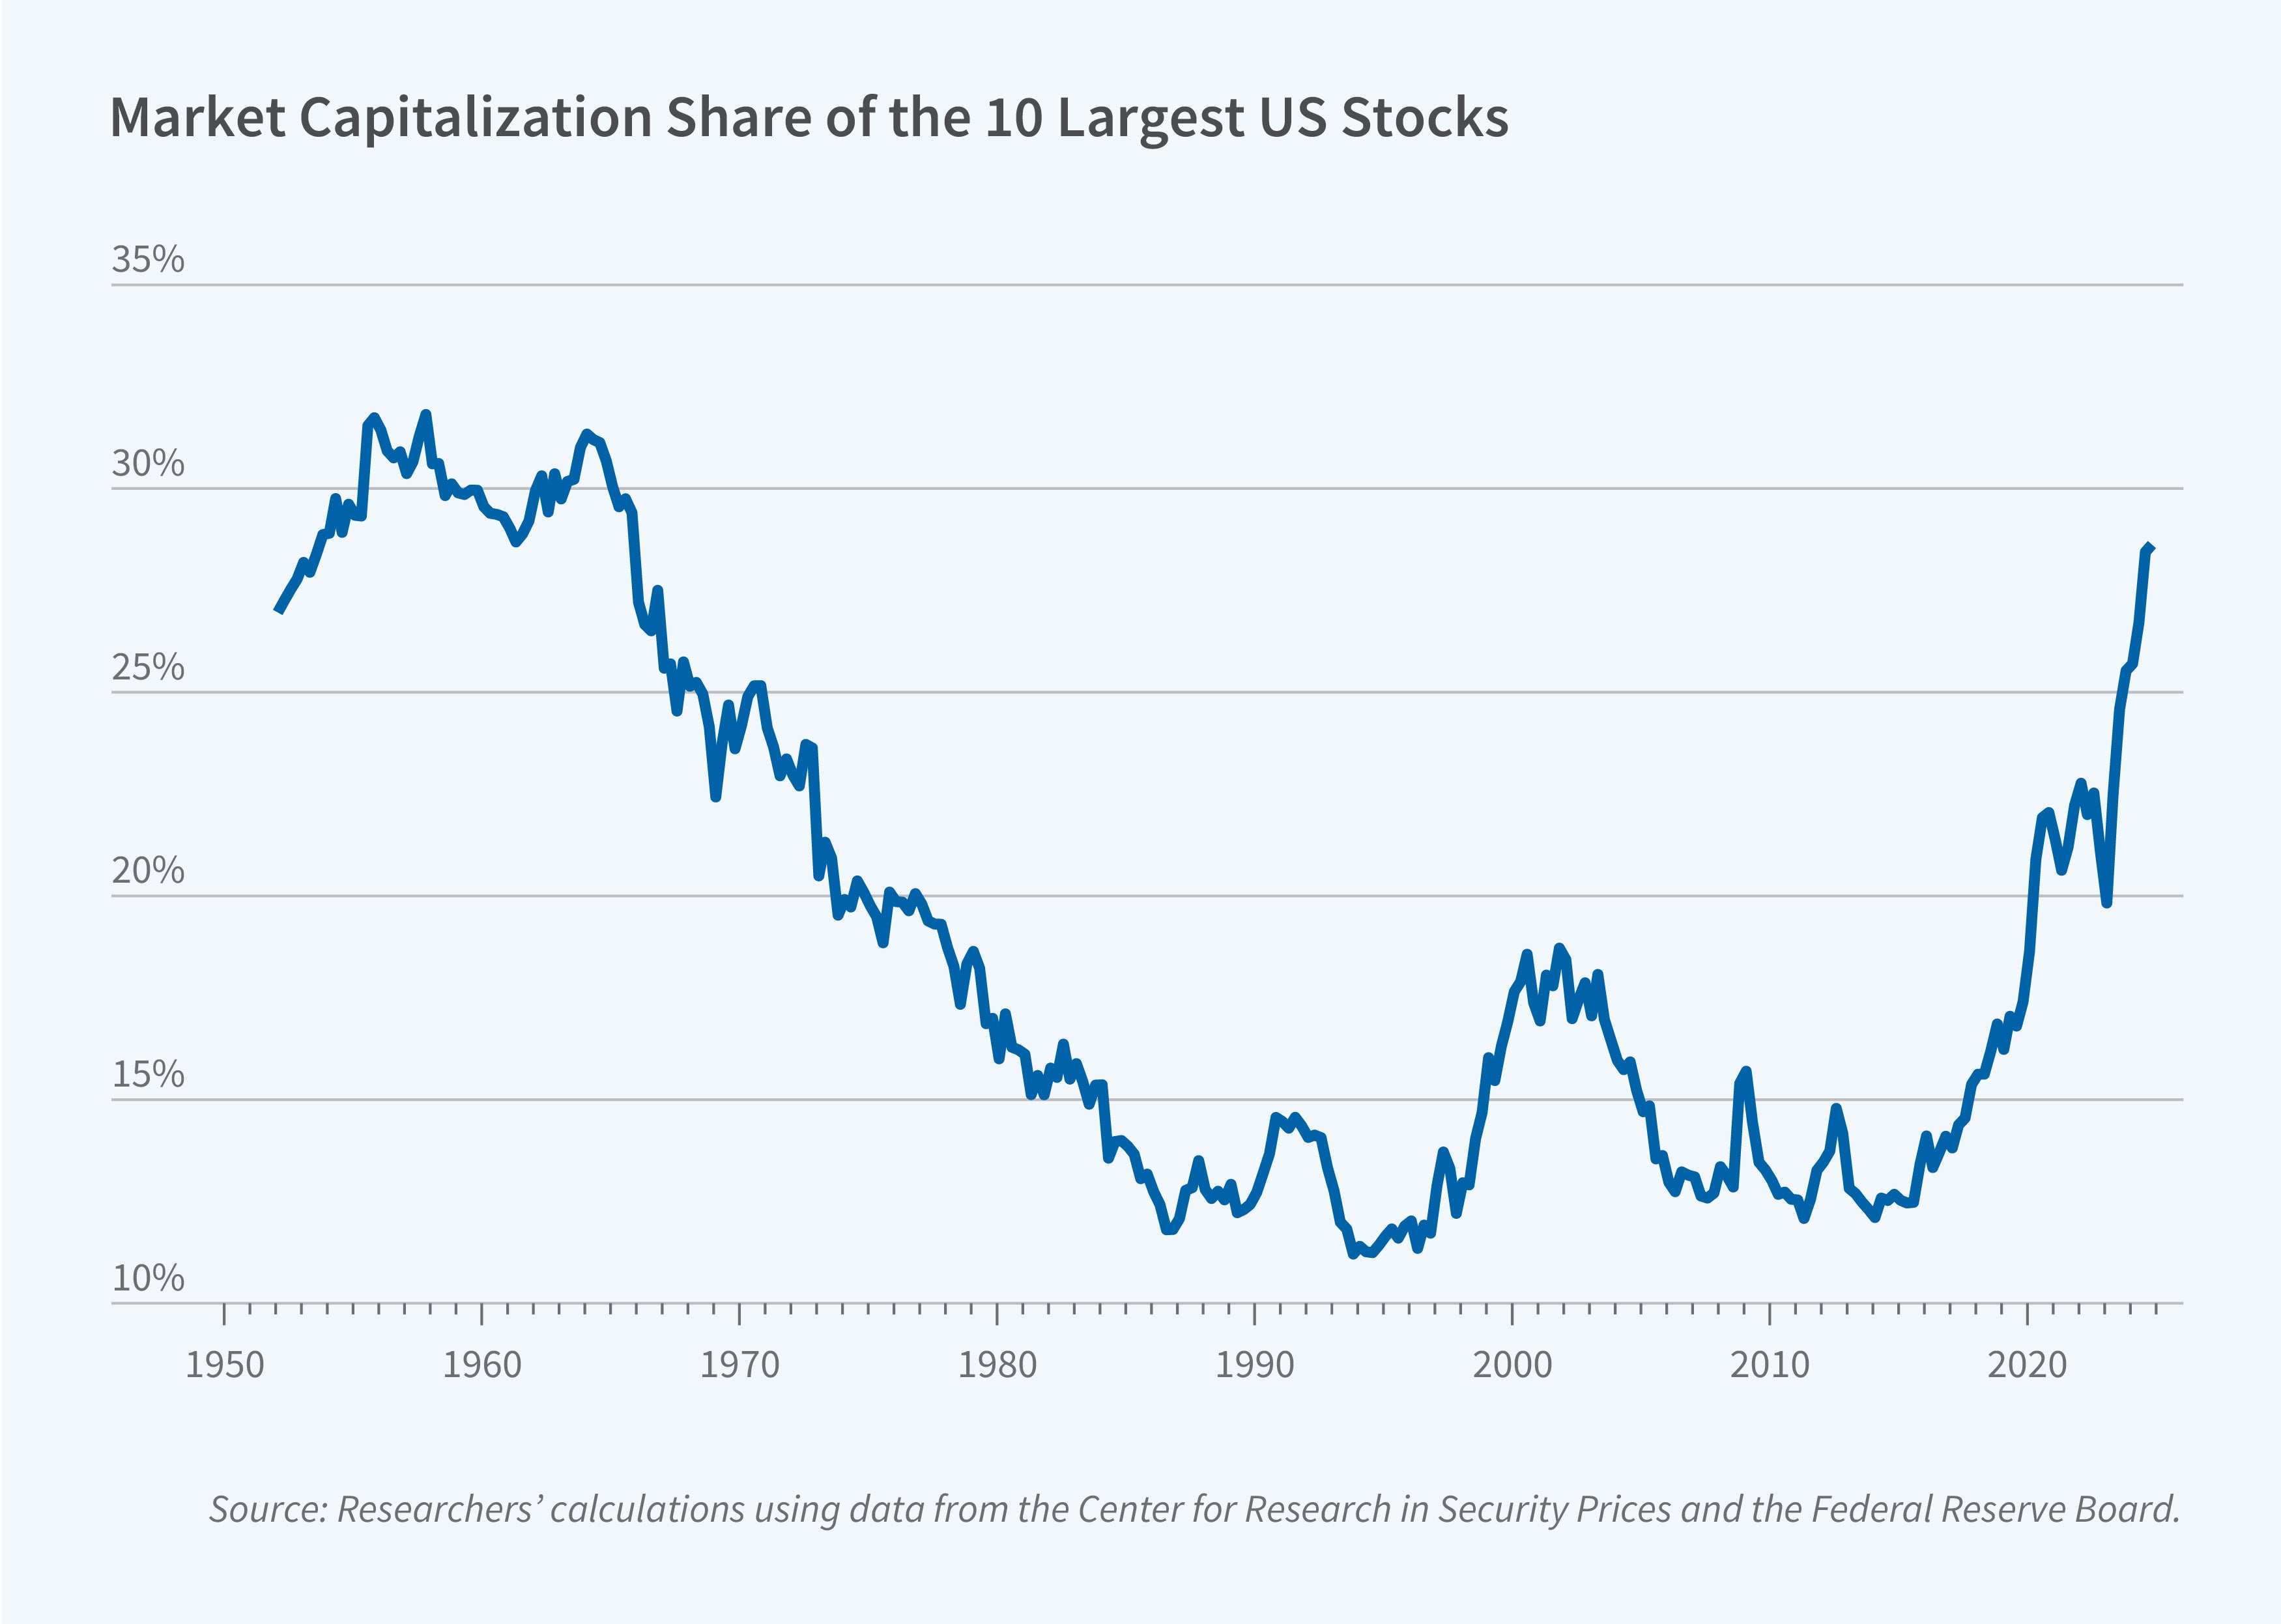
The US stock market has become more concentrated in recent years. Between 2015 and 2024, the share of the 10 largest stocks in total market capitalization rose from 13 to 31 percent, with the “Magnificent 7” companies alone accounting for roughly one-third of the S&P 500 by the end of 2024. This concentration poses a practical challenge for the thousands of investment funds that must comply with long-standing diversification rules designed for a far less top-heavy market.
In The Hidden Cost of Stock Market Concentration: When Funds Hit Regulatory Limits (NBER Working Paper 35007), researchers Lubos Pastor, Taisiya Sikorskaya, and Jinrui Wang investigate how a specific regulatory constraint—the “50/5/10 rule”—affects fund behavior and, ultimately, stock prices. The rule, codified in the Internal Revenue Code, requires that at least 50 percent of a fund’s total assets be composed of positions in which no single issuer represents more than 5 percent of total assets and the fund holds no more than 10 percent of the issuer’s voting securities. Virtually all US mutual funds and exchange-traded funds comply with this requirement to maintain their tax-advantaged status as Regulated Investment Companies.
Mutual funds approaching the IRS 50/5/10 portfolio concentration limit trim large positions, reduce equity exposure, and subsequently underperform.
The researchers analyze quarterly portfolio holdings for 4,745 US domestic equity funds between September 2019 and December 2024. For each fund and quarter, they compute a “buffer”—50 percent minus the aggregate weight of a fund’s large positions—to measure proximity to breaching the rule. A fund is classified as “constrained” when its buffer falls between 0 and 5 percent.
The 50/5/10 constraint, historically a formality, has become increasingly binding. Constrained fund assets rose from negligible levels in the third quarter of 2019 to 6 percent of total fund assets by the fourth quarter of 2024. At the peak in the third quarter of 2024, 171 funds representing 4.5 percent of all domestic equity funds were constrained. These funds managed almost $1.4 trillion (8 percent of total fund assets). The effect was concentrated in large-cap growth: by the third quarter of 2024, approximately one-third of these funds were constrained, managing over $1.1 trillion—about half of the category’s total assets.
When funds approach the constraint, they adjust their portfolios in two ways. First, they rebalance away from their largest holdings toward smaller-capitalization stocks and intensify trimming when large positions are near the 5 percent threshold and exhibit higher return volatility. Second, constrained funds reduce their overall equity exposure.
Large-cap growth funds that were constrained earned significantly lower risk-adjusted returns in the five months following their constrained quarter. Over the first three months following the constrained quarter, the average large-cap growth fund’s four-factor-adjusted return was 28 basis points lower than that of the full sample. This underperformance deepened to 1.04 percent during the 2023–24 period, when the constraint was especially binding.
The researchers construct a “constrained ownership share” for each stock that measures the fraction of outstanding shares held as large positions by constrained funds. During 2023–24, stocks with positive constrained ownership significantly outperformed those with unconstrained ownership at horizons from 1 to 12 months. At the six-month horizon, these stocks earned cumulative abnormal returns that were 2.3 percent higher than stocks with unconstrained ownership.
These results are consistent with temporary underpricing of stocks with positive constrained ownership, which are among the largest-capitalization stocks in the market. The 50/5/10 rule effectively constrains funds’ long positions, limiting the ability of optimistic investors to scale their positions. The researchers argue that, just like short-sale constraints can produce overpricing by limiting pessimistic investors’ views, long-position constraints can generate underpricing by suppressing optimists’ views.
The researchers acknowledge support from the Fama-Miller Center for Research in Finance at the University of Chicago Booth School of Business.


