Banking Regulations and 1970s Stagflation
Between 1965 and 1982, the US economy endured four severe downturns, each accompanied by surging inflation—a combination known as stagflation. One prominent explanation of this experience points to unanchored inflation expectations and a series of adverse supply shocks, most notably the OPEC oil crises of 1973 and 1979, that were outside the control of monetary policy. A new study challenges that interpretation, arguing that an overlooked financial friction created by banking regulations played a central role.
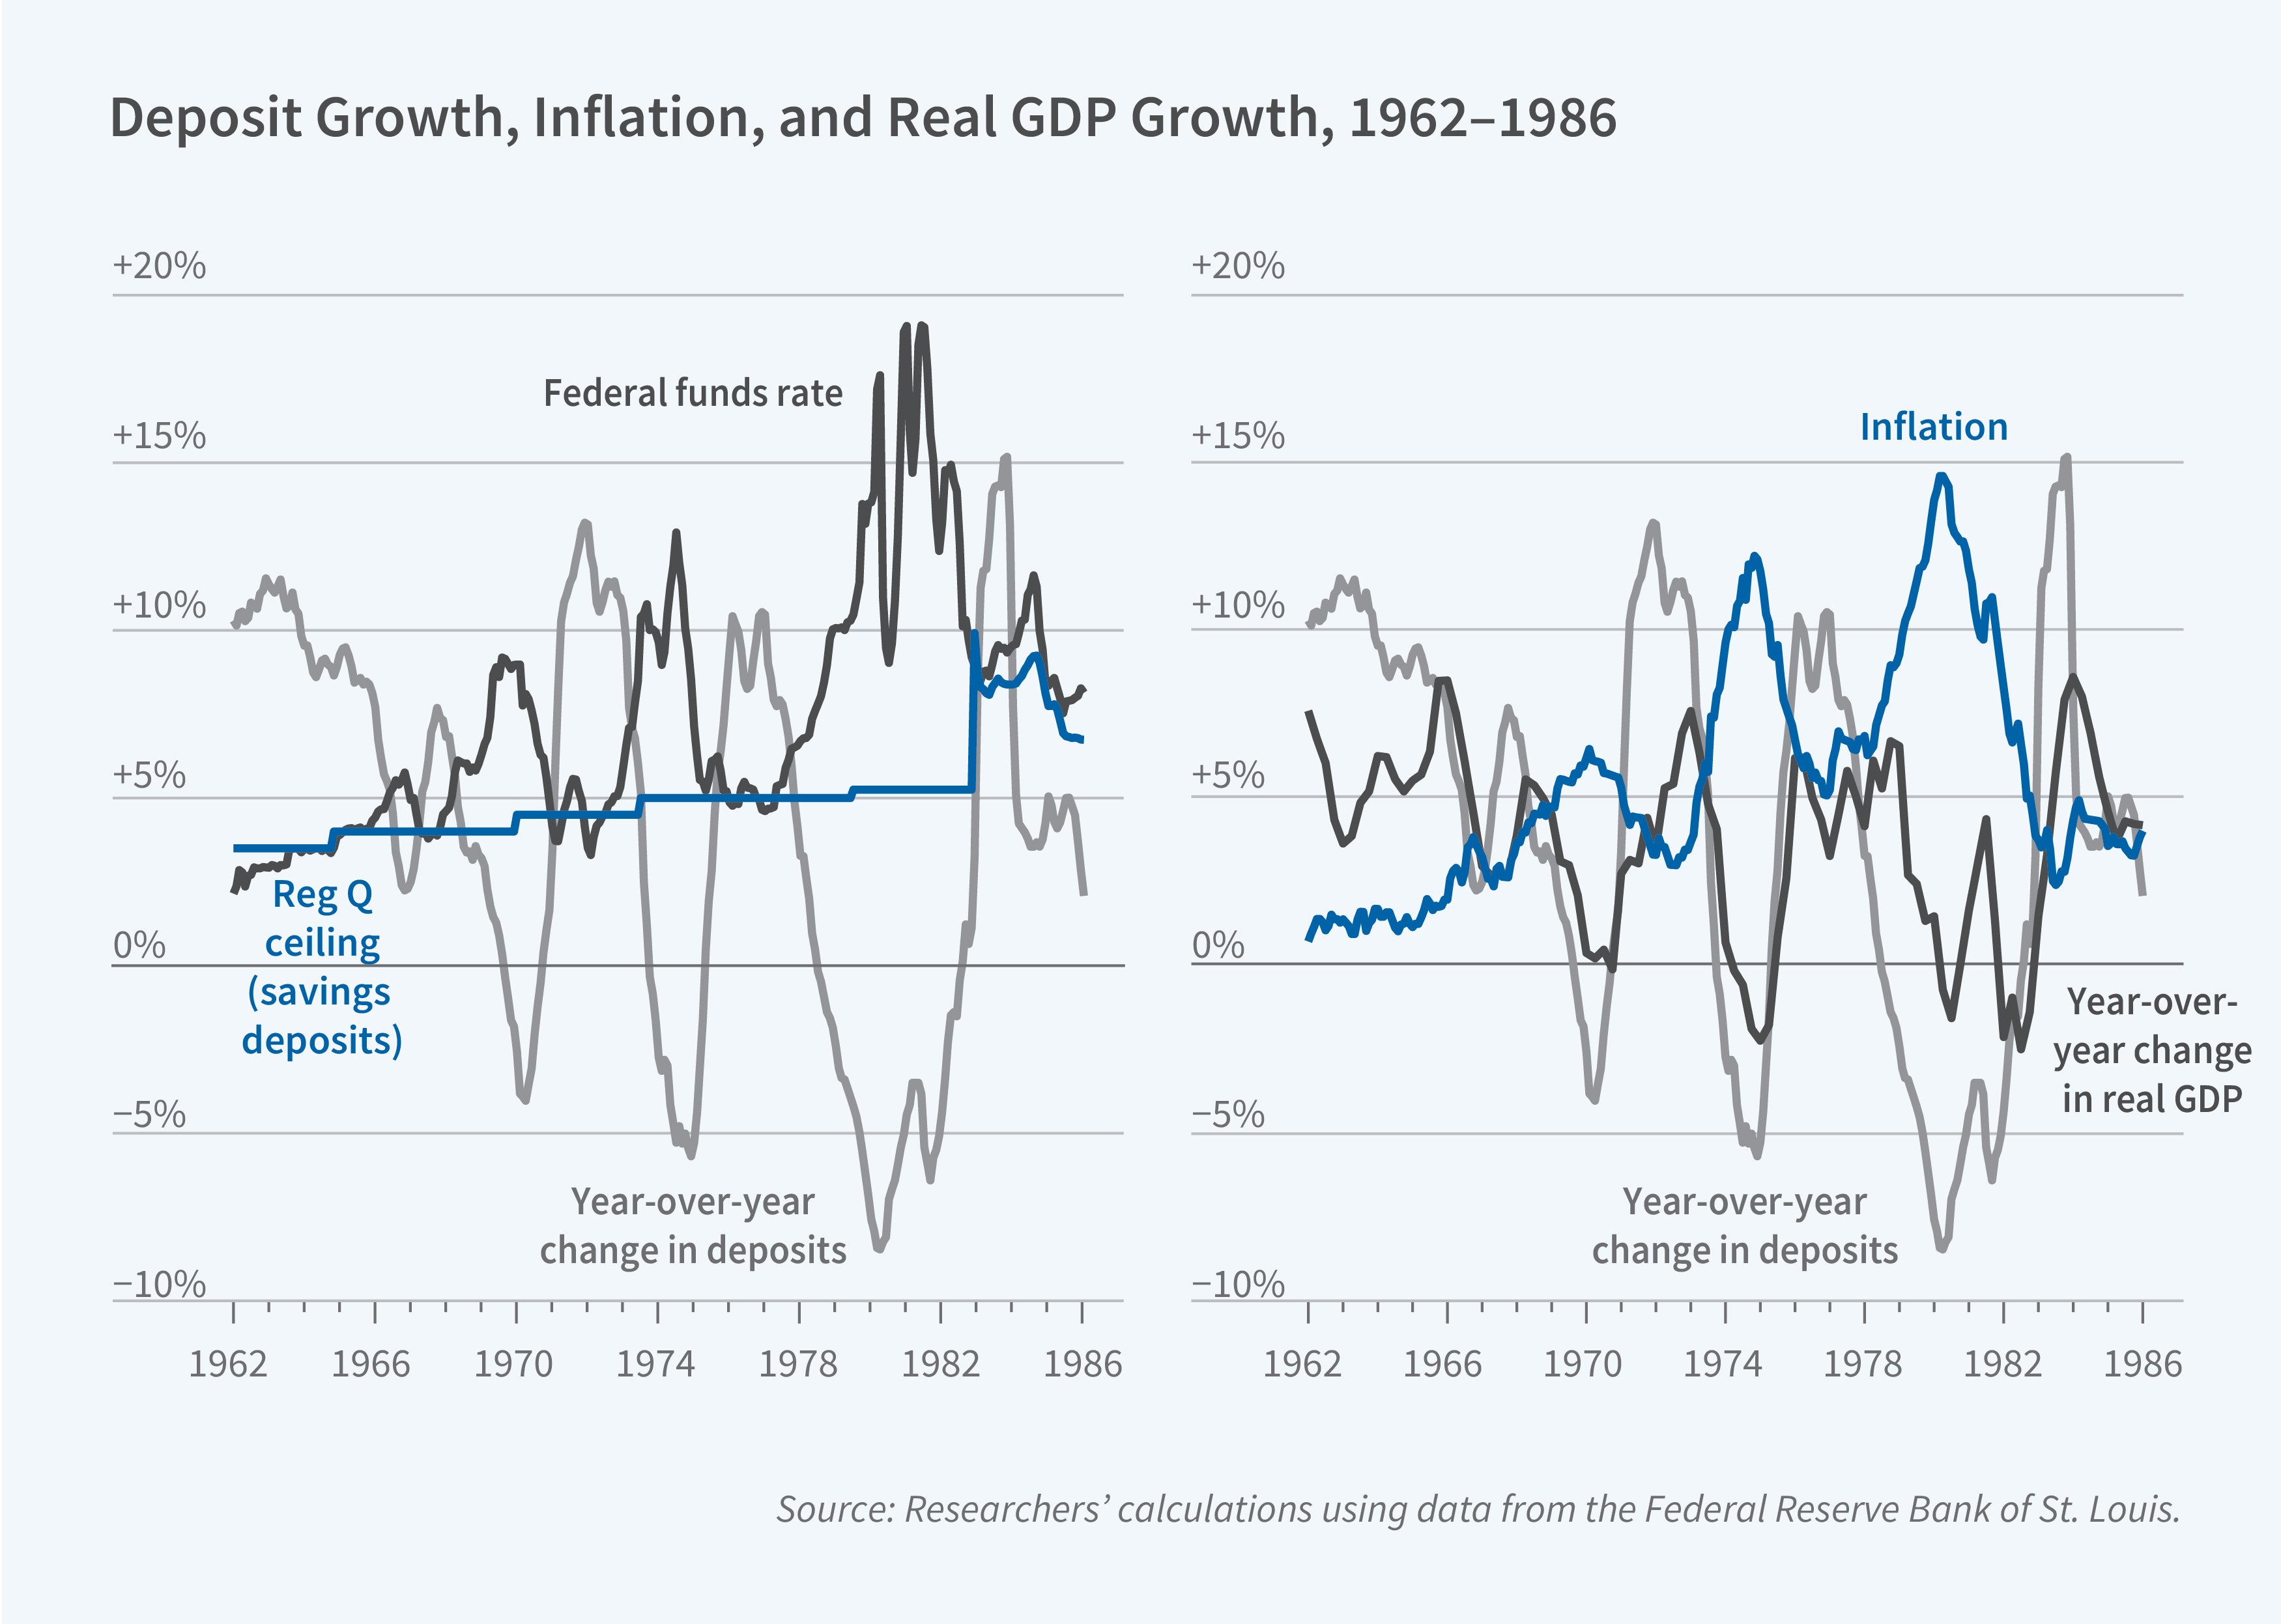
In Credit Crunches and the Great Stagflation (NBER Working Paper 35057), Itamar Drechsler, Alexi Savov, and Philipp Schnabl contend that Regulation Q (Reg Q)—a banking law that capped deposit interest rates—triggered severe credit crunches whenever the Federal Reserve raised rates. These credit crunches disrupted firms’ ability to finance production, thereby generating endogenous negative supply shocks that contributed to stagflation.
Regulation Q’s cap on deposit rates caused credit crunches that raised firms’ production costs and contributed to the stagflation of the 1970s by turning monetary tightening into a negative supply shock.
When the federal funds rate exceeded the Reg Q ceiling, households shifted savings out of bank deposits and into higher-yield alternatives like money market funds. Facing a loss of their primary funding source, banks contracted lending. Because firms rely on bank credit to finance working capital—materials, labor, and inventory needed before sales revenue arrives—the resulting credit squeeze raised production costs. Firms responded by increasing prices and reducing output, resulting in a supply shock. The researchers formalize this channel by developing an extended New Keynesian model in which monetary tightening reduces aggregate supply in addition to demand when Reg Q binds.
At the aggregate level, the researchers document that whenever the federal funds rate rose above the Reg Q ceiling, deposit growth fell sharply and bank credit contracted. These contractions coincided with declining GDP growth and rising inflation. Impulse response analysis confirms that credit-tightening shocks predicted lower output and higher inflation during the Reg Q period but not after this regulation was relaxed.
Industries with high external finance dependence—those less able to cover working capital costs from retained profits—raised prices and cut output relative to less dependent industries during each credit crunch. A 1 percentage point increase in the Reg Q spread led finance-dependent industries to raise prices by 1.9 percent and reduce output by 3.8 percent relative to industries that could self-finance.
Industries with greater working capital intensity also experienced higher prices and lower output during the credit crunches. A bank-level Reg Q spread constructed from variation in deposit composition across banks strongly predicts deposit outflows and contractions in commercial and industrial lending. Counties with banks that faced more binding Reg Q constraints also saw larger declines in manufacturing employment.
The researchers also study the period following the removal of Reg Q in 1982. While deposit rates were no longer capped, passthrough remained low due to the deposits channel of monetary policy. The authors estimate that their credit crunch mechanism was at least three times more powerful during Reg Q than after.


