Why Has US Healthcare Expenditure Growth Slowed?
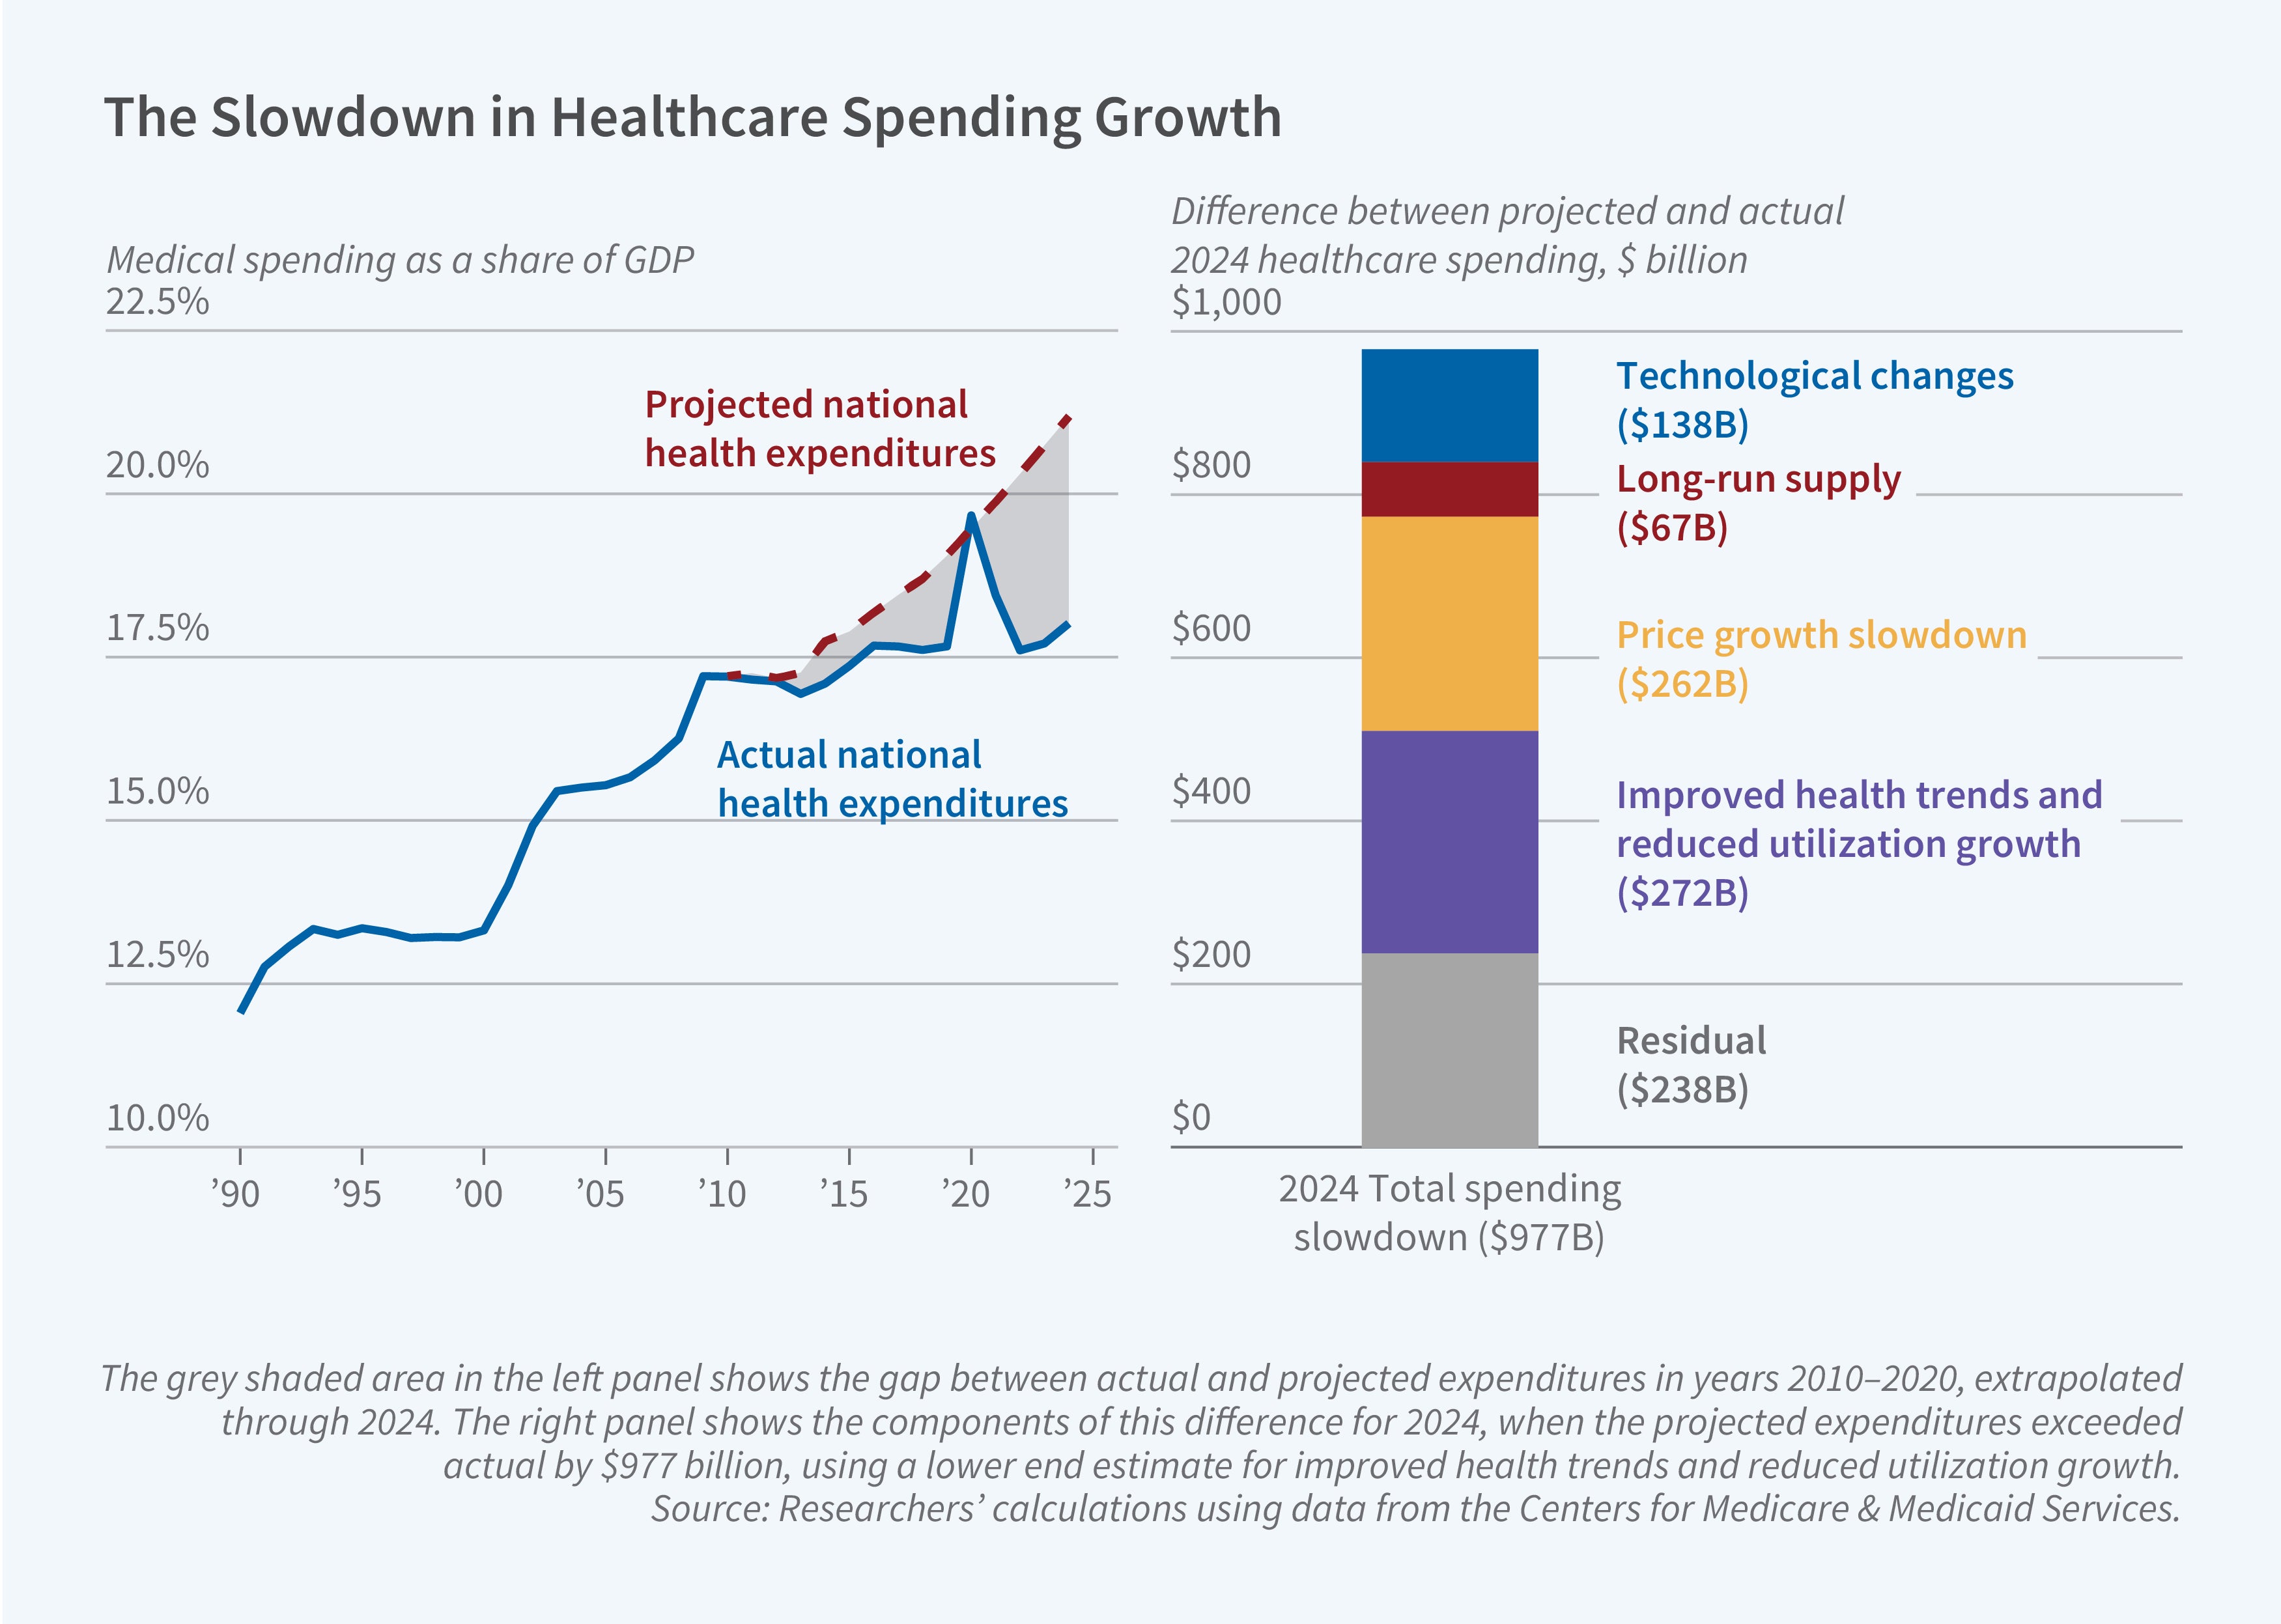
Between 2010 and 2024, medical spending in the US grew from 17.2 percent of GDP to 18.0 percent. This growth was substantially below both historical precedent and actuarial projections by the Centers for Medicare and Medicaid Services (CMS). By 2024, annual healthcare expenditures were nearly $1 trillion (15 percent) below the 2010 projections.
In Has the United States Bent the Health Care Cost Curve? (NBER Working Paper 35231), David M. Cutler and Lev R. Klarnet examine potential explanations for this sustained period of slower growth. They compare actual expenditures to the 2010 CMS actuarial forecast, adjusting for differences between anticipated and realized inflation. Because the slowdown was evident across all payers, the researchers focus their analysis on the total market for medical care goods and services. They decompose the overall slowdown into differences that are attributable to utilization, prices, long-run supply, and technological change.
Cost-saving technology and changes in insurance design that affect utilization have reduced expenditures relative to projections 15 years ago.
Slower growth in the quantity of care is the most important contributor to the overall slowdown. Utilization changes account for at least 28 percent of the overall slowdown and explain at least $272 billion of the difference between actual spending in 2024 and the 2010 forecast. Lower-than-expected use of care is partly attributable to population health improvements. For example, declines over time in impairment among the elderly diminished the need for long-term services.
Other utilization changes—such as a substantial slowdown in imaging growth—likely reflect shifts toward value-based reimbursement by insurers, higher cost-sharing, greater price sensitivity among patients, and tighter insurer restrictions on use. These same factors may also have slowed growth in the use of existing branded prescription drugs, a deceleration that accounts for 12 percent of the overall spending slowdown. Another contributor to slower-than-projected growth in the use of branded drugs was the tendency for newer blockbuster drugs to target conditions with narrower markets, such as particular cancers. By comparison, many of the blockbuster drugs of the 2000s, such as painkillers and antidepressants, had broad potential markets and therefore saw greater growth in use over time.
In a separate calculation, the researchers estimate that shifts in insurance design during the study period could have generated a $163 billion decline in utilization (17 percent) in 2024. Because they are uncertain about whether this decline explains or adds to the estimated 28 percent lower quantity of care, the researchers provide a range of percentages of the overall slowdown that may be attributable to utilization changes, from 28 percent to 45 percent.
A reduction in the rate of price growth explains approximately 27 percent of the overall slowdown. Price growth fell from 1 to 2 percentage points above general inflation in the 2000s to roughly the rate of inflation after 2010. One contributor to this difference was adjustments in administered prices. For example, a 2013 Medicare regulatory change reclassified inpatient admissions for “observational stays” as outpatient care, cutting reimbursement for those stays by roughly two-thirds. While there were some offsetting increases in price growth due to upcoding of patients and hospital acquisitions of physician practices, the net effect of changes in price growth was a savings of $262 billion in 2024.
A phenomenon the researchers label “greater long-run supply” explains 7 percent of the spending slowdown. The increasing share of prescription drugs that lost patent protection was a key contributor. Within the first two years of the study period, for example, loss of exclusivity for drugs such as Lipitor, Zyprexa, and Plavix generated a 14 percent decline in prescription drug spending. Increased long-run supply generated savings of $67 billion in 2024.
Finally, the introduction of cost-saving technology accounts for 14 percent of the overall spending slowdown. The researchers argue that “technological innovation has shifted toward cost-saving advances as the market matures.” They highlight the development of minimally invasive surgical procedures, which allowed an increasing share of major procedures, such as hip and knee replacements, to be performed on an outpatient rather than inpatient basis. Because outpatient procedures cost an estimated 40 percent less than inpatient procedures, this change in surgical practices generated considerable savings.
In addition, new technology has contributed to improvements in population health, reducing demand for healthcare. For example, the data show a substantial decline in hospital admissions for acute cardiovascular conditions, such as heart attacks, heart failure, and stroke. The researchers argue that these changes are plausibly explained by the adoption of new preventive medical technology, including drugs that control blood pressure, reduce cholesterol, and manage blood sugar. This decline in hospitalizations for cardiovascular conditions alone accounts for 3 percent of the overall slowdown. In 2024, technological change accounted for $138 billion in savings.
Taken together, the factors identified by the researchers explain at least 75 percent and as much as 92 percent of the almost $1 trillion difference between actual and projected costs in 2024.