When Input Prices Rise, Cheaper Varieties See Higher Inflation
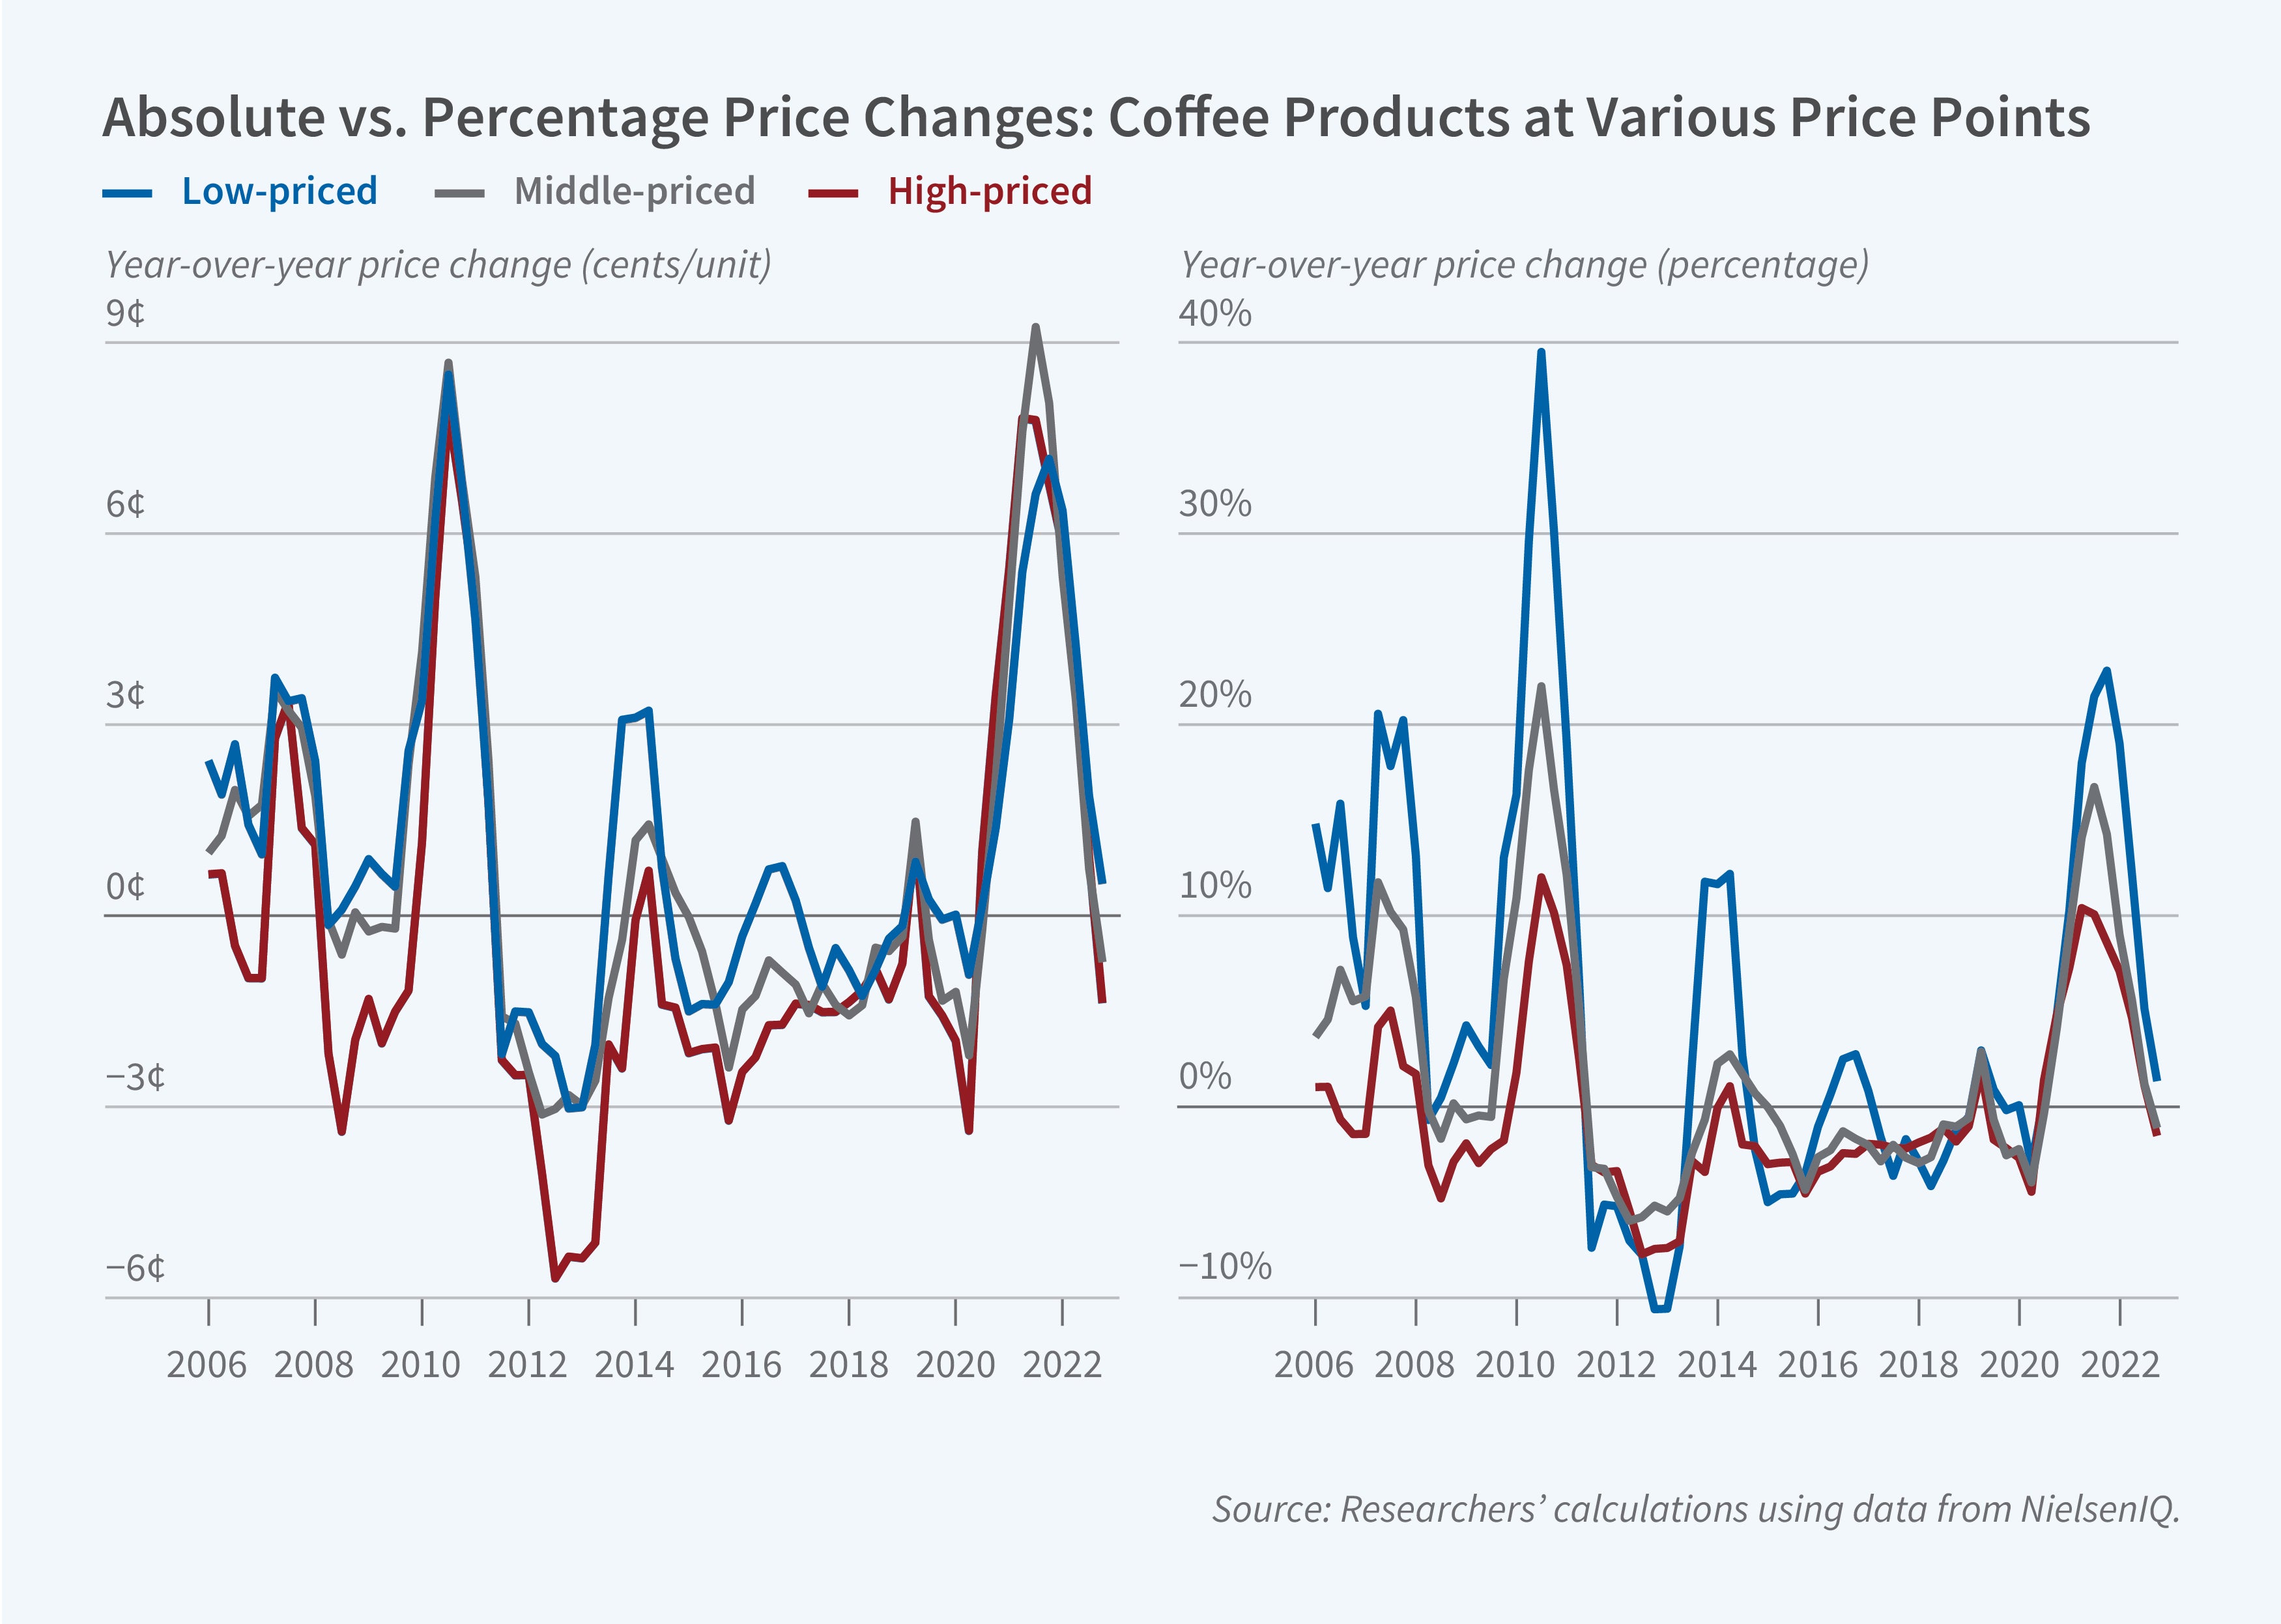
Observers of the 2021–2023 inflation noticed that cheaper products exhibited much higher inflation rates. What explains these differences in inflation, and what are the effects on households across the income spectrum? In Cheapflation Cycles (NBER Working Paper 35235), Kunal Sangani finds that the way firms pass through cost changes creates systematic differences in inflation between cheap and expensive product varieties, leading to differences in inflation experienced by consumers in different income strata. The study draws primarily on NielsenIQ retail scanner data covering food-at-home sales across more than 30,000 retail stores from 2006 to 2023, alongside NielsenIQ Homescan Consumer Panel data tracking purchases by about 60,000 US households each year.
Many firms pass through cost increases as similar absolute price increases across product varieties, resulting in higher inflation for the lowest-priced varieties.
Sangani finds that firms selling low-price and high-price varieties alike tend to pass input cost increases through to consumers on an absolute, dollars-and-cents basis. Because the same absolute price increase is a larger share of a lower initial price, however, cheaper varieties within a category experience higher inflation in percentage terms when input costs rise. For example, in the case of coffee, Sangani finds that increases in agricultural coffee prices are passed through cent-for-cent uniformly across product varieties. That implies that logarithmic pass-through is substantially higher for cheaper varieties, though—0.57 log points for the lowest unit-price quintile versus 0.18 log points for the highest. Since lower-income households disproportionately purchase cheaper varieties—for example, coffee products purchased by the lowest-income quintile are on average 24 percent less expensive than those bought by the top quintile—this pricing behavior translates directly into higher inflation rates for lower-income consumers.
Extending the analysis to the full food-at-home basket shows that this pass-through behavior can explain surges in “cheapflation” seen during the Great Recession and 2021–2023 inflation. Over the period from 2006 to 2023, within-category inflation differences driven by pass-through in levels account for 57 percent of the variance in the inflation gap between the top and bottom income quintiles. Adding differences in household spending shares across product categories explains another 13 percent.
The Bureau of Labor Statistics constructs consumer price indices using 273 entry-level item (ELI) categories, with inflation rates pooled across varieties within each category. This aggregation masks the differential sensitivity of cheaper varieties within each category. This, in turn, understates the higher cost sensitivity and volatility of food-at-home inflation for low-income households.
The variance of food-at-home inflation rates is 21 percent higher for the lowest-income quintile than the highest in the disaggregated scanner data, versus just 6.3 percent higher in ELI-aggregated data—an understatement of roughly 70 percent. Over 2021–2023, the disaggregated data show 2.4 percentage points more food-at-home price growth for the lowest-income quintile relative to the highest, compared to only 0.3 percentage points in income-specific price indices constructed from official statistics. Sangani shows that the same patterns may extend to other categories beyond food at home.