The Valuation Gap Between US and European Firms
Since 2008, the combined stock market value of publicly listed US companies has grown far faster than that of their European counterparts. In The Value Gap: Europe Cannot Scale (NBER Working Paper 35577), Bo Becker, Efraim Benmelech, and Joao Monteiro examine potential explanations for the widening valuation gap. They construct a time series of aggregate stock market values for the US and Europe using data from the World Federation of Exchanges and the World Bank, and combine this with firm-level data from Compustat covering 9,117 US and 7,015 European firms during the 2008–2023 period.
In the last two decades, US firms have grown much faster, on average, than their European counterparts. The latter appear to face barriers to scaling up their markets and higher capital costs.
In 2008, US market capitalization exceeded Europe’s by about a third, or roughly $3 trillion. By 2023, the gap was $34 trillion. Over this period, US equity markets quadrupled in value while European markets rose by 70 percent. US market capitalization rose from 78 to 177 percent of GDP, while Europe’s rose from 43 to 63 percent.
The number of listed firms in this period was roughly stable in the US and rose in Europe, so the growth in relative US value came entirely from the increasing average value of firms. This pattern holds even after excluding the largest 1 percent of firms by market value, and it holds within narrowly defined (4-digit SIC code) industry groups. Within these groups, the average ratio of market value to book value of assets is about 50 percent higher for US firms than for comparable European firms.
Over the 15 years the researchers study, the gap in valuations grew more for younger firms. It widened by 82 percent for the youngest quintile of firms but only 20 percent for the oldest quintile. The gap is also larger in industries where returns to scale are higher: it is 42 percent in low-scale industries and 55 percent in high-scale ones.
The researchers identify two structural constraints that limit European firms’ ability to grow: challenges in scaling their markets, and higher capital costs. First, using cross-sectional variation, they find that the sales of European firms are closely tied to local economic conditions. A 1 percent increase in the GDP of the country in which a company is headquartered is associated with a 0.8 percent increase in sales for European firms, even for those operating in tradable sectors. By comparison, in the US, the correlation between GDP growth in the state in which a firm is headquartered and the growth of firm sales is not statistically different from zero. European firms thus appear tied to their home markets in a way that US firms are not.
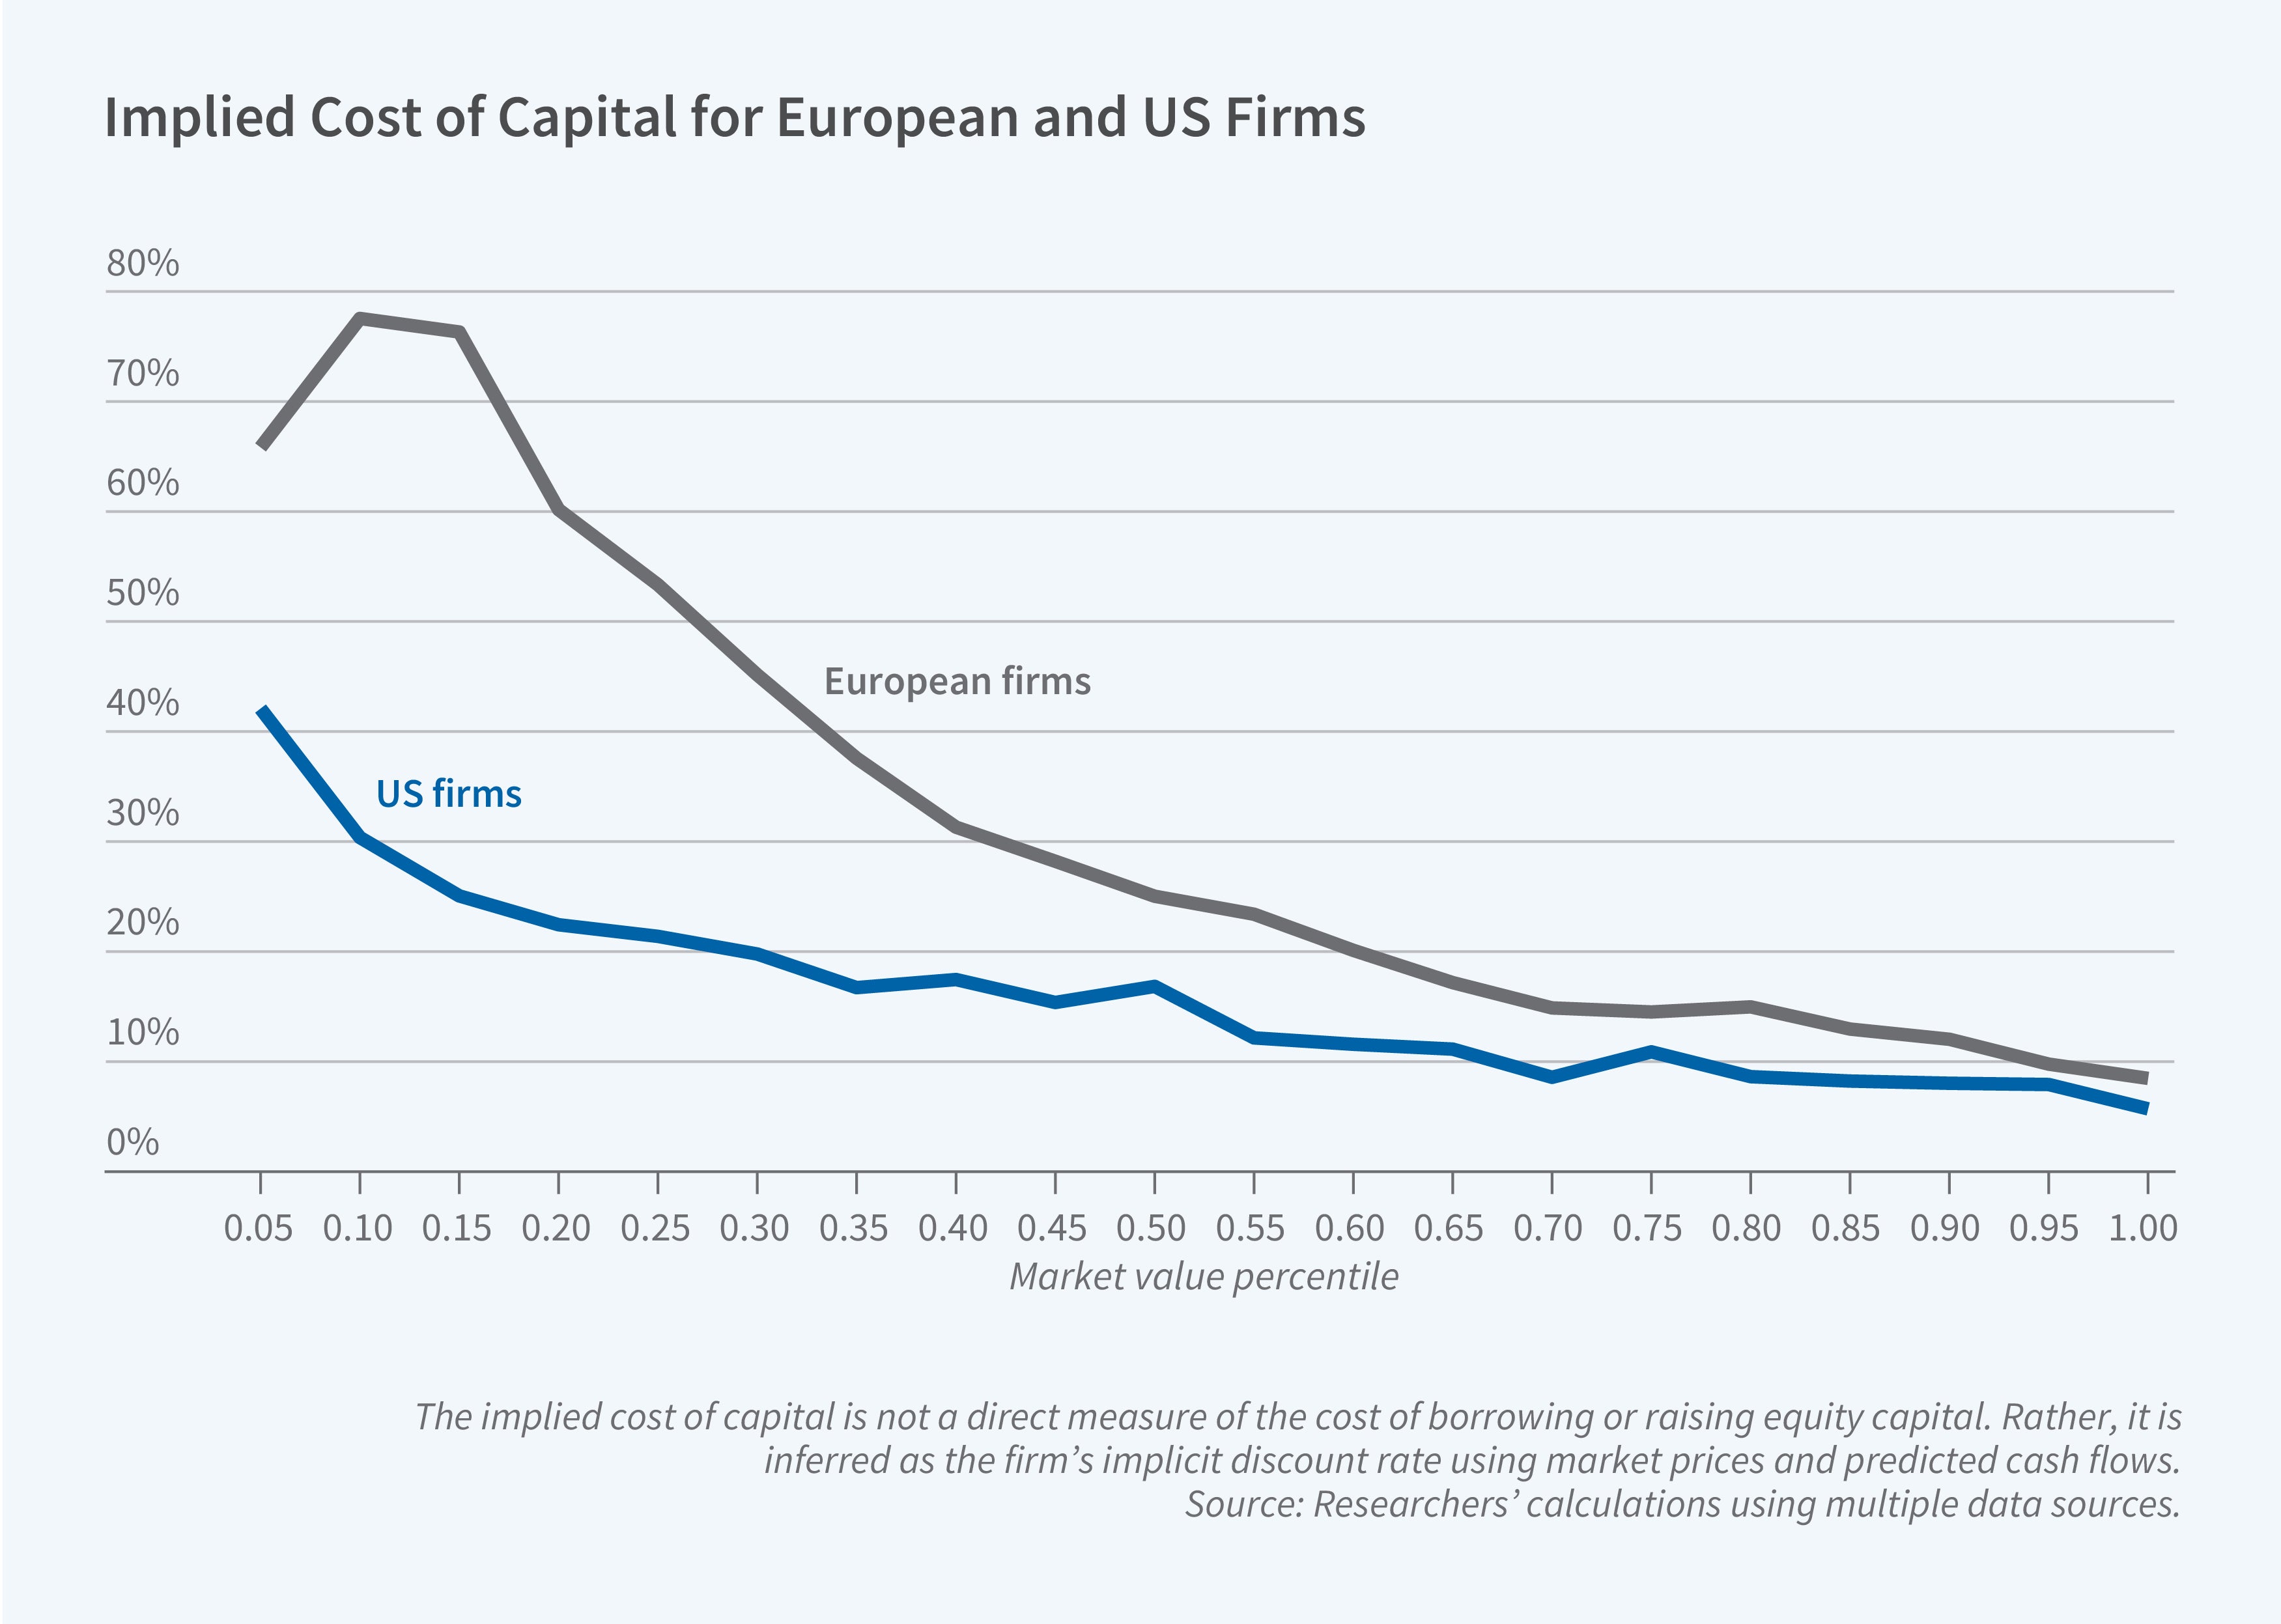
Second, European firms face both equity and debt financing disadvantages relative to their US counterparts. With respect to equity finance, European firms have less access to venture capital funding. Such funding reached 0.5 percent of GDP in the US in 2023 but was no greater than 0.15 percent of GDP in any European country. The equity financing constraint is most binding for smaller firms. For each firm, the researchers compute the implied cost of capital: the discount rate that equates the firm’s current market value with the present value of its expected future earnings. They then sort firms into percentiles by market value and compute the average implied cost of capital within each percentile. At the bottom of the size distribution, the gap is stark: Small European firms face an implied cost of capital above 60 percent, compared with below 40 percent for their US counterparts. At the top of the distribution, by contrast, the largest firms in both regions face much lower costs of capital, with no significant difference between Europe and the US.
The researchers also find that US firms are generally more levered than their European counterparts and so the valuation gap extends to total firm value and is not an artifact of capital structure. The leverage gap between US and European firms remained stable between 2008 and 2023. US firms also have access to a more diversified set of debt financing sources: bond markets and private credit play a much larger role in the US, whereas European firms rely predominantly on bank loans.