House Price Gains and U.S. Household Spending from 2002 to 2006
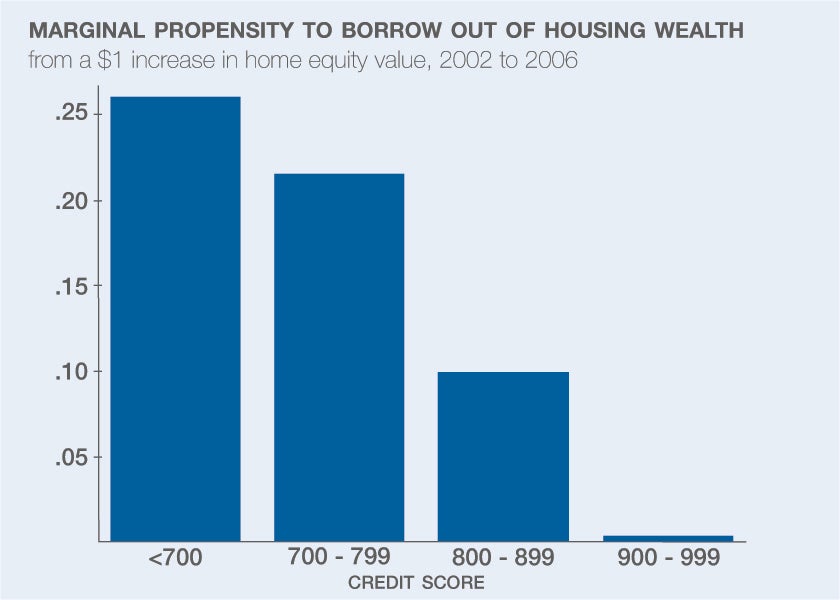
Homeowners borrowed $0.19 per $1 of home equity gains from 2002 to 2006.
In House Price Gains and U.S. Household Spending from 2002 to 2006 (NBER Working Paper No. 20152), Atif Mian and Amir Sufi find that rising housing values promote spending, especially for low-income households, if refinancing provides "cash on hand." They also find that this spending has a significant impact on GDP.
The study finds that between 2002 and 2006, if one zip code experienced a rate of house price growth that was 20 percentage points greater than another, then it would also, on average, experience an annual rate of mortgage refinancing, with some cash withdrawn from the home, about three percent higher than the lower-appreciation zip code. This effect was seen almost entirely in zip codes where the average 2002 income was less than $50,000 per household. Among zip codes with average income more than $100,000, cash-out refinancing was almost zero.
This confirms the conventional view that lower cash-on-hand households most commonly tap their home equity when home values rise. But do they also spend that money? In terms of new car purchases, Mian and Sufi find that the general propensity to spend on new cars is $0.02 per dollar of home-value increase. But this effect is $0.03 for zip codes where households have an average 2002 income of $35,000 or less and zero for households living in zip codes in which the average income is $100,000 or more. The researchers also find evidence that in the years after the housing boom, low-income zip codes customarily experienced a dramatic reduction in both income and auto purchases.
Mian and Sufi say the results illustrate why the level of wealth held by those who experience financial shocks can matter for the economy. They note that the total housing market decline of 2007 to 2009 was similar in magnitude to the crash in equity values in 2001. Yet the macroeconomic effects were very different because most stock market wealth is held by the high end of the wealth-distribution spectrum, where there is a very low marginal propensity to consume. Similarly, the house price recovery from 2011 onwards did not contribute as much to economic activity as the 2002 to 2006 housing gains. This was likely because the borrowing channel was effectively shut down for those most responsive to house price gains.
In short, low cash-on-hand households treated the rise in home values as a cash-on-hand shock. On average, homeowners borrowed $0.19 per $1 of home equity gains from 2002 to 2006. Furthermore, households living in low-income zip codes spent this extra cash. Mian and Sufi estimate that, under certain assumptions, rising home values raised aggregate consumer spending by 0.08 percent of GDP in 2003, 0.8 percent in 2004, and 1.3 percent in both 2005 and 2006.
-- Matt Nesvisky


