Who Ultimately Pays Credit Card Interchange Fees?
Every time a consumer swipes a credit card, the merchant pays an interchange fee—typically around 1.9 percent of the transaction value—most of which funds the rewards that cardholders receive. Because merchants generally charge the same prices regardless of how customers pay, consumers who use cash or debit cards effectively help finance the rewards enjoyed by credit card users. In Who Pays for Payments? (NBER Working Paper 35067), Mark L. Egan, Gregor Matvos, Amit Seru, Lulu Wang, and Vincent Yao use novel merchant-level data from Fiserv—one of the largest US merchant acquirers—to measure how the payment system redistributes resources.
The primary dataset contains establishment-level payment data from 2006 to 2022, including total payment values, transaction counts, and interchange fees paid for different card types. The data are organized at the merchant-sector-location level, allowing the authors to analyze geographic variation in payment activity and merchant pricing. The authors’ cross-sectional analysis focuses on the 2022 cross-section, which covers approximately 1 million merchants and represents roughly one-fifth of all US card payments. A second dataset with about 800,000 merchants from 2019 to 2022 uniquely captures cash transactions alongside card payments, allowing the authors to study the full mix of payment methods used by consumers and merchants. The researchers supplement these with consumer survey data from the Federal Reserve Bank of Atlanta’s Survey and Diary of Consumer Payment Choice and the MRI-Simmons national studies survey to link payment preferences to household income.
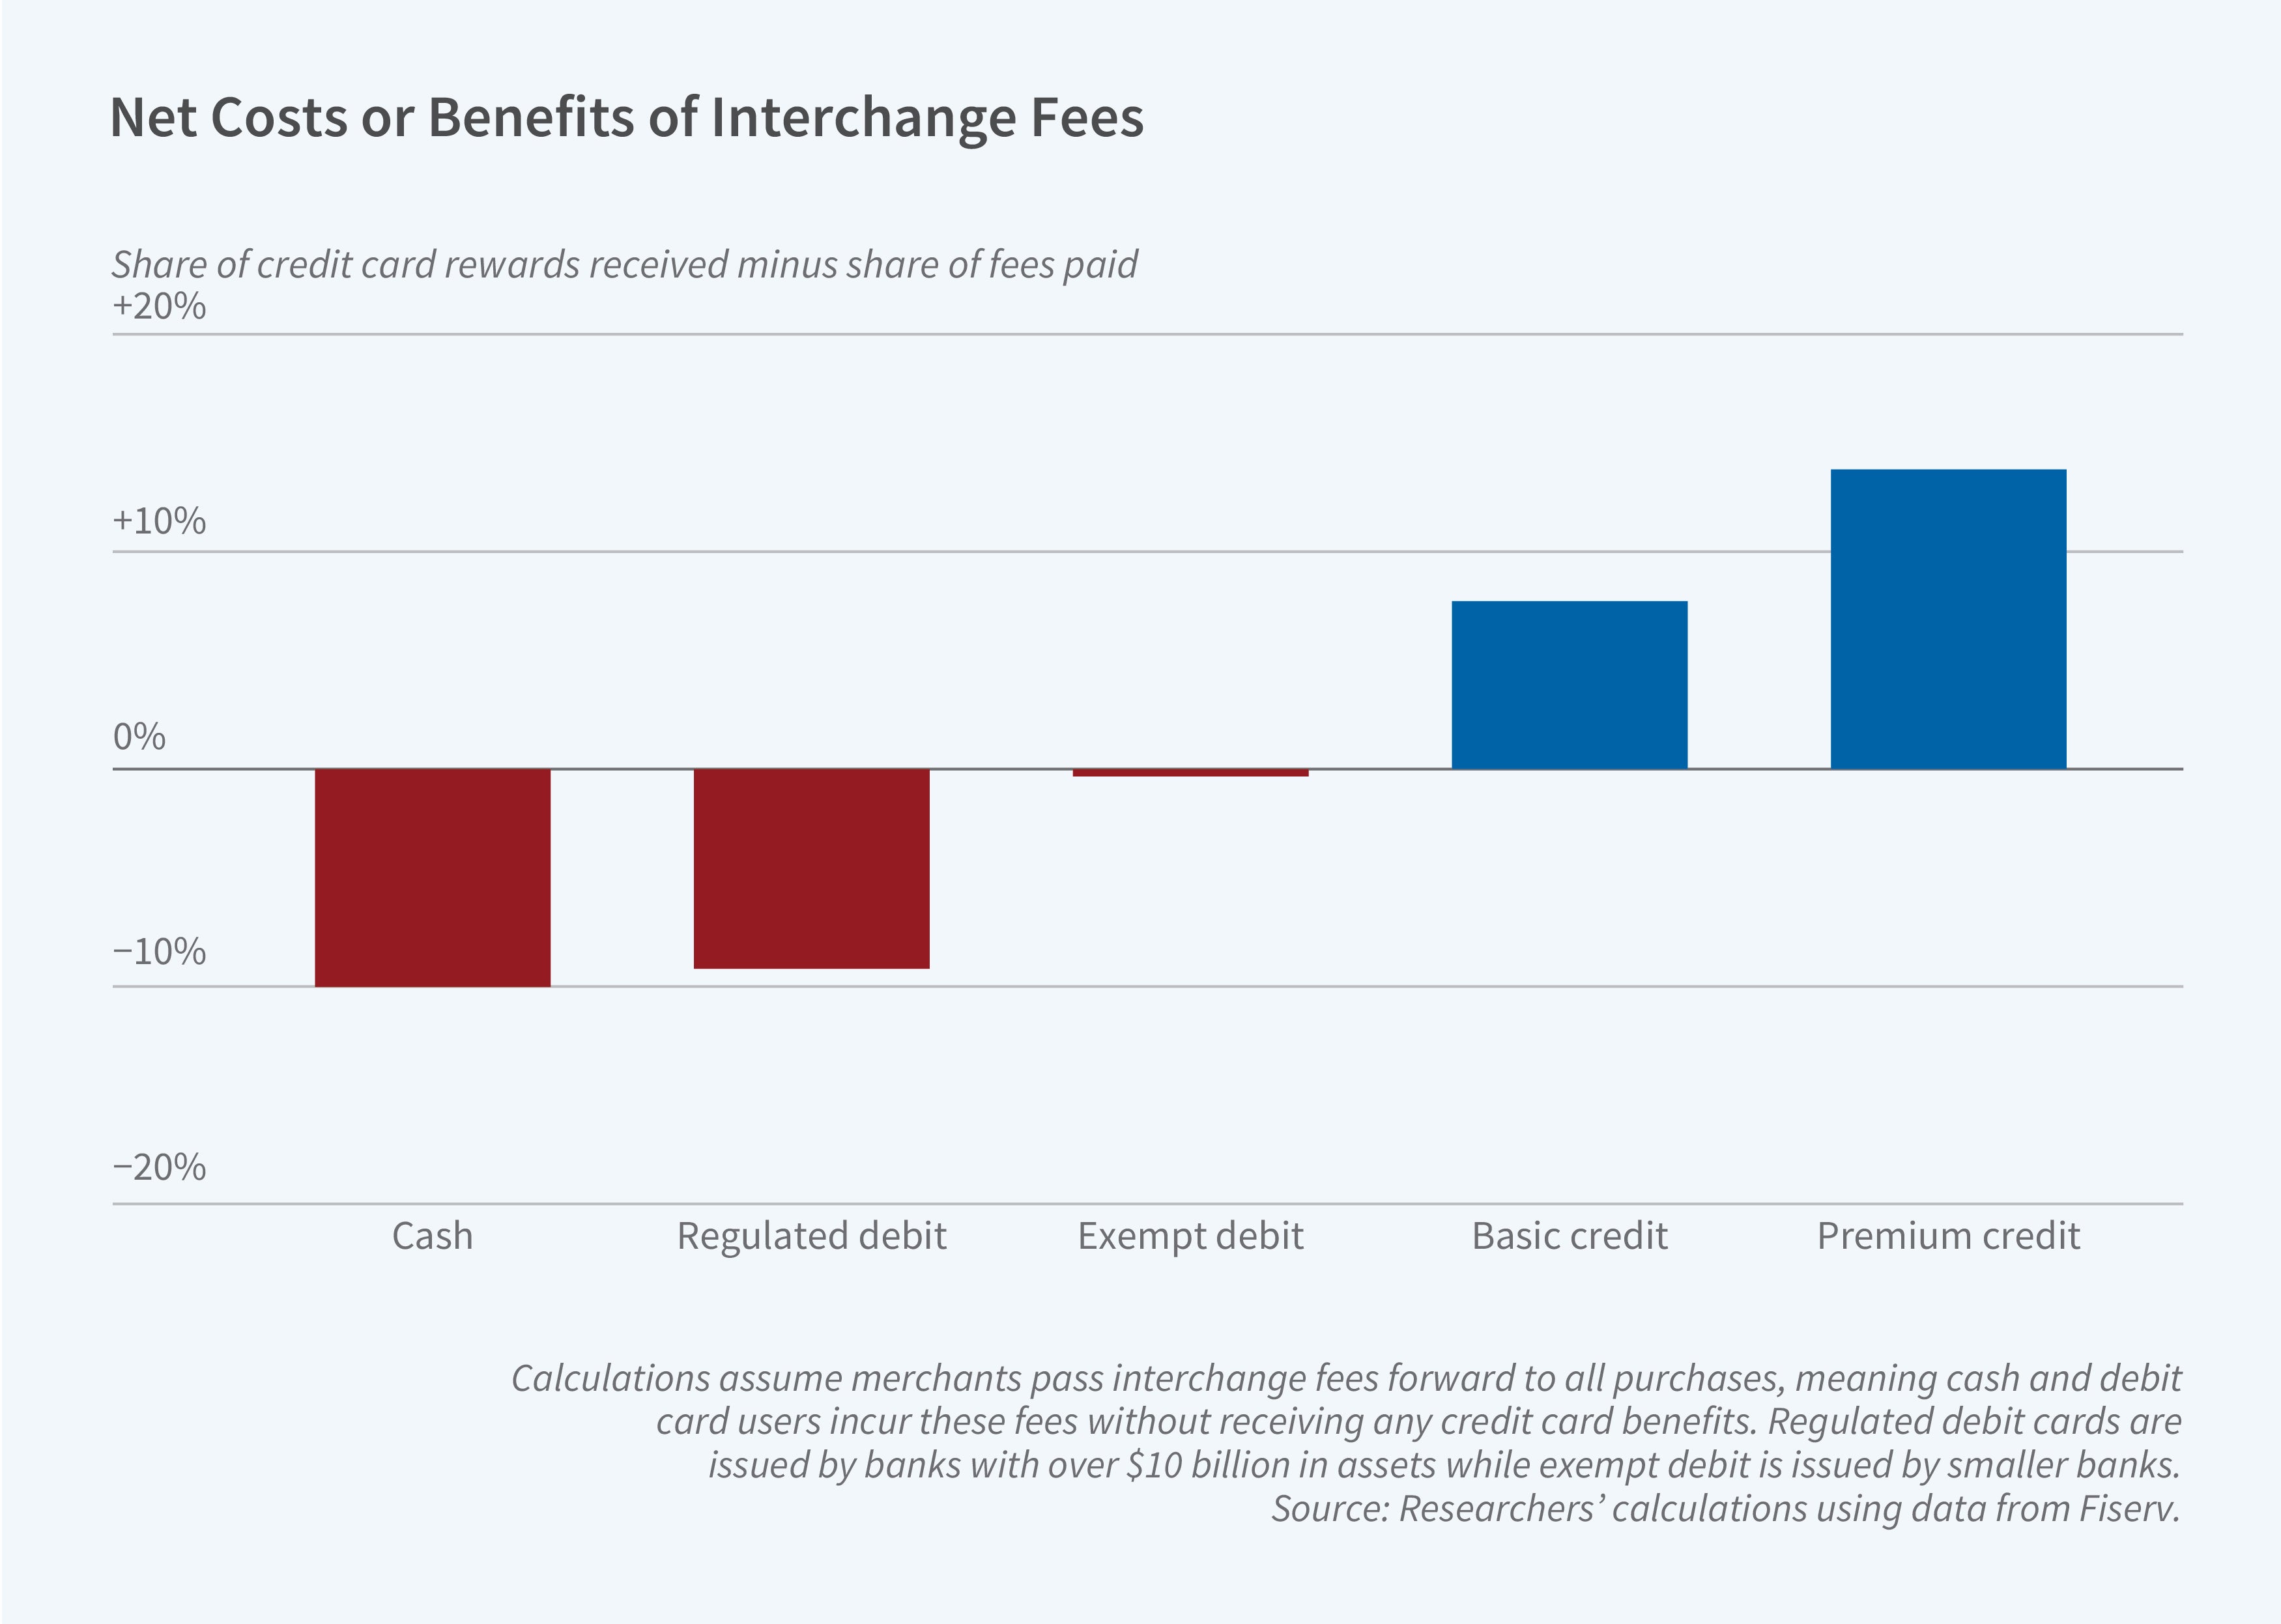
The researchers’ analysis using these datasets suggests that interchange fees transfer approximately $30 billion annually from cash and debit card users to credit card users. Cash users lose about 96 basis points of purchasing power, and regulated debit card users lose roughly 47 basis points, while basic and premium credit card users gain approximately 48 and 59 basis points, respectively. Because credit card use rises with income, the system generates an estimated $9.2 billion annual transfer from households earning less than $150,000 to those earning more.
Two forces moderate this redistribution. First, the tendency for cash, debit, and credit card users to shop at different merchants limits the overlap necessary for cross-subsidization. Second, where overlap does occur, such as at large grocery stores and gas stations, interchange fees tend to be lower due to sector discounts and negotiated rates. Together, these forces reduce the transfer by approximately 25 percent relative to the transfer that would occur with homogeneous consumers and merchants.
The researchers also examine the redistributive consequences of two specific developments in the payment system. The first is the Durbin Amendment, which capped interchange fees on debit cards issued by large banks. The authors show that one perhaps unintended consequence of the amendment was that it primarily benefited credit card users through lower retail prices at the expense of regulated debit card users, who lost approximately $9.6 billion in rewards and free checking benefits. This was a net transfer from middle-income to higher-income households. The second development is the rise of premium credit cards, which grew from 15 percent of credit card volume in 2006 to 60 percent by 2022. This has also been a regressive development. While premium cardholders gained about $7.9 billion, debit card users—not cash users—bore the largest dollar losses because they shop most frequently alongside premium card users.