New Evidence on Income Inequality
In 1980, the bottom half of the income distribution received about 20 percent of national income; by 2014, that share had declined to 12 percent.
Income inequality in the United States, measured using the cash income sources that are reported on income tax returns and analogous data from household surveys, has surged since 1980. But the total flow of income reported by households in survey or tax data adds up to barely 60 percent of the U.S. national income. In Distributional National Accounts: Methods and Estimates for the United States (NBER Working Paper 22945) Thomas Piketty, Emmanuel Saez, and Gabriel Zucman combine tax, survey, and national accounts data to create inequality statistics that capture 100 percent of U.S. national income. The researchers compute the distribution of both pre-tax and post-tax income. Post-tax series deduct all taxes and add back all transfers and public spending, so that both pre-tax and post-tax incomes add up to national income. This allows them to provide the first comprehensive view of how government redistribution affects inequality.
Average pre-tax income for the bottom 50 percent of the income distribution has stagnated since 1980 at some $16,000 per adult per year, and the income of the top 1 percent of the distribution has increased sharply. In 1980, adults in the top 1 percent averaged 27 times the income of those in the bottom 50 percent; today, they average 81 times that income.
The researchers also find that rising income from investments rather than rising income from work has fueled the surge for the top 1 percent since 2000, and that the influx of women into the workforce has helped tamp down inequality.
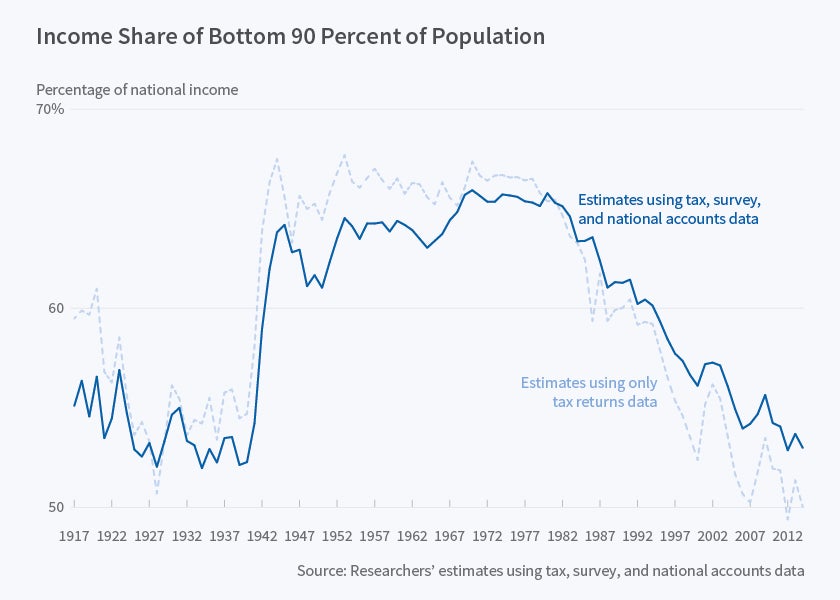
The share of pre-tax national income accruing to the top 10 percent has grown less since 1980 than Piketty and Saez estimated previously, in a study using data from tax returns. This implies that the bottom 90 percent have done somewhat better than previously thought. While tax return data suggest that the average pre-tax income of this group declined by 0.1 percent per year, the new analysis using more comprehensive data shows that it actually grew by 0.8 percent a year. That still lags average income growth of 1.4 percent a year, and stands in contrast to the 1946 to 1980 period, when the bottom 90 percent's income grew about 2 percent a year, the same growth rate as average income. Average pre-tax national income for middle-class adults—with income between the median and the 90th percentile—has grown 40 percent since 1980, faster than previously estimated.
The researchers find that the redistribution of income through transfer programs has offset only a small fraction of the increase in inequality.
The stagnation of incomes for households in the bottom 50 percent is particularly noteworthy given the growth for those in the top 1 percent. In 1980, the bottom half received about 20 percent of national income; by 2014, their share had declined to 12 percent. For the top 1 percent, the picture is exactly the reverse: In 1980, they received 12 percent of national income; in 2014, they received 20 percent. Although transfers have increased through Social Security and other programs, the elderly and the middle class, rather than those in the bottom half of the income distribution more generally, have been the largest beneficiaries.
"Given the massive changes in the pre-tax distribution of national income since 1980, there are clear limits to what redistributive policies can achieve," they conclude.
—Laurent Belsie


