Medical Report Cards and Hospital Quality
The quality of the U.S. health care system has come under increasing scrutiny in recent years. A 1999 Institute of Medicine report estimated that preventable medical errors result in the deaths of at least 44,000 people each year, more than the number of deaths from motor vehicle accidents, breast cancer, or AIDS. In addition to the loss of life, these errors are estimated to result in at least $8.8 Billion in unnecessary health care costs and billions more in lost productivity.
In the wake of this and similar reports, public and private sector leaders have come together to found new initiatives for health care quality, such as the National Quality Forum and the Leapfrog Group. These organizations seek to measure the quality of health care providers and to make this information publicly available to enable consumers to make more informed choices.
While the idea of medical report cards is increasingly popular, their effects on medical productivity are not yet well understood. In The Role of Information in Medical Markets: An Analysis of Publicly Reported Outcomes in Cardiac Surgery, (NBER Working Paper 10489), David Cutler, Robert Huckman, and Mary Beth Landrum examine the effects of a medical report card program in New York State. While most previous analyses have focused on comparing trends in states with and without report cards, the authors examine the effect of report cards on providers in a given state, allowing them to observe bigger differences in quality among their sample and to make use of detailed data on patient health.
New York's Cardiac Surgery Reporting System (CSRS), which began in the late 1980s, collects data on patients' medical history and on whether they die in the hospital following surgery. Every 12 to 18 months, the State announces which hospitals performed better or worse than the statewide average by a statistically significant margin. To account for the fact that some hospitals treat more severely ill patients, the State compares each hospital's mortality outcome to that which would be expected given the composition of its patient population (the "risk-adjusted" mortality rate).
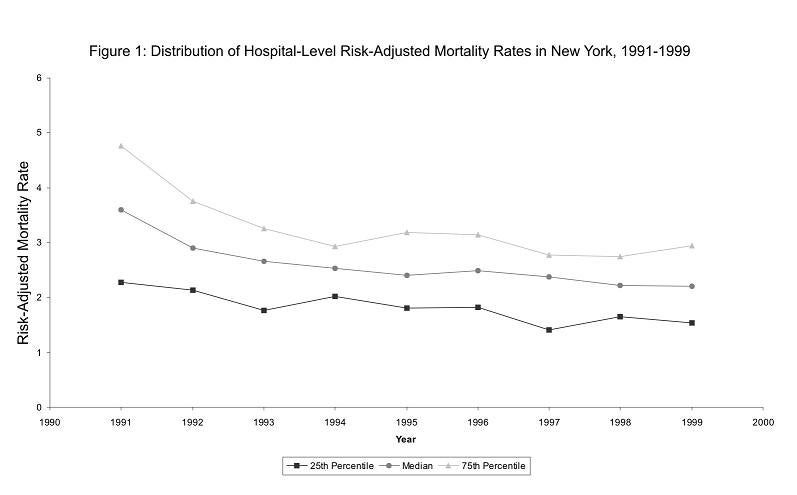
The authors first examine the effect of the report card program on the distribution of risk-adjusted mortality rates across hospitals. As Figure 1 illustrates, the difference between the mortality rate of hospitals at the 25th and 75th percentiles of the distribution narrowed significantly in the early years of the program, suggesting improved performance by low-quality hospitals.
The authors test for this response more directly in a statistical analysis and find that receiving a high-mortality flag is associated with a 1.2 percentage point decrease in the hospital's risk-adjusted mortality rate over the next 12 months. As the average mortality rate in the sample is 2.55 percent, this is a very large response.
Finally, the authors examine how the allocation of patients across hospitals is affected by the report card program. They find that receiving a high-mortality flag results in a decrease in bypass surgery volume of about 10 percent for an average-sized hospital. Interestingly, this effect is driven entirely by a decrease in volume among healthier patients.
As the authors note, this finding is compatible with either a demand-side response - patients who do not need surgery immediately (or their referring doctors) may choose to pass over low-quality hospitals -or a supply-side response - some surgeons at poor-performing hospitals may do fewer procedures or leave the hospital, which would generate a less healthy patient pool if those surgeons were handling more routine cases. The authors conclude that further research is warranted to better understand the effects of medical report cards.


