Household Portfolio Rebalancing and Equity Market Fluctuations

How investors adjust their portfolios in response to movements in asset prices and other shocks is a key input to asset pricing models, yet data limitations mean there is relatively little evidence on these behavioral responses, particularly for high-net-worth households. In Asset Demand of US Households (NBER Working Paper 32001), Xavier Gabaix, Ralph S. J. Koijen, Federico Mainardi, Sangmin Oh, and Motohiro Yogo leverage a new dataset on households’ portfolios to explore portfolio rebalancing behavior.
The data were provided by Addepar, a wealth management platform that provides investment advisors with data analytic tools. The researchers analyze data from January 2016 to March 2023. The security-level dataset includes information on a broad set of households across the wealth distribution, including 990 ultra-high-net-worth (UHNW) households, defined as those with portfolios worth more than $100 million, and it covers a broad set of asset classes at a very high frequency. Addepar collects information on indirect holdings (e.g., through mutual funds, hedge funds, and exchange-traded funds) as well as direct holdings, and the data cover public and private asset classes. The Addepar data provide a larger sample of high-net-worth households than US household surveys, such as the Survey of Consumer Finances, and can therefore be used to study their behavior.
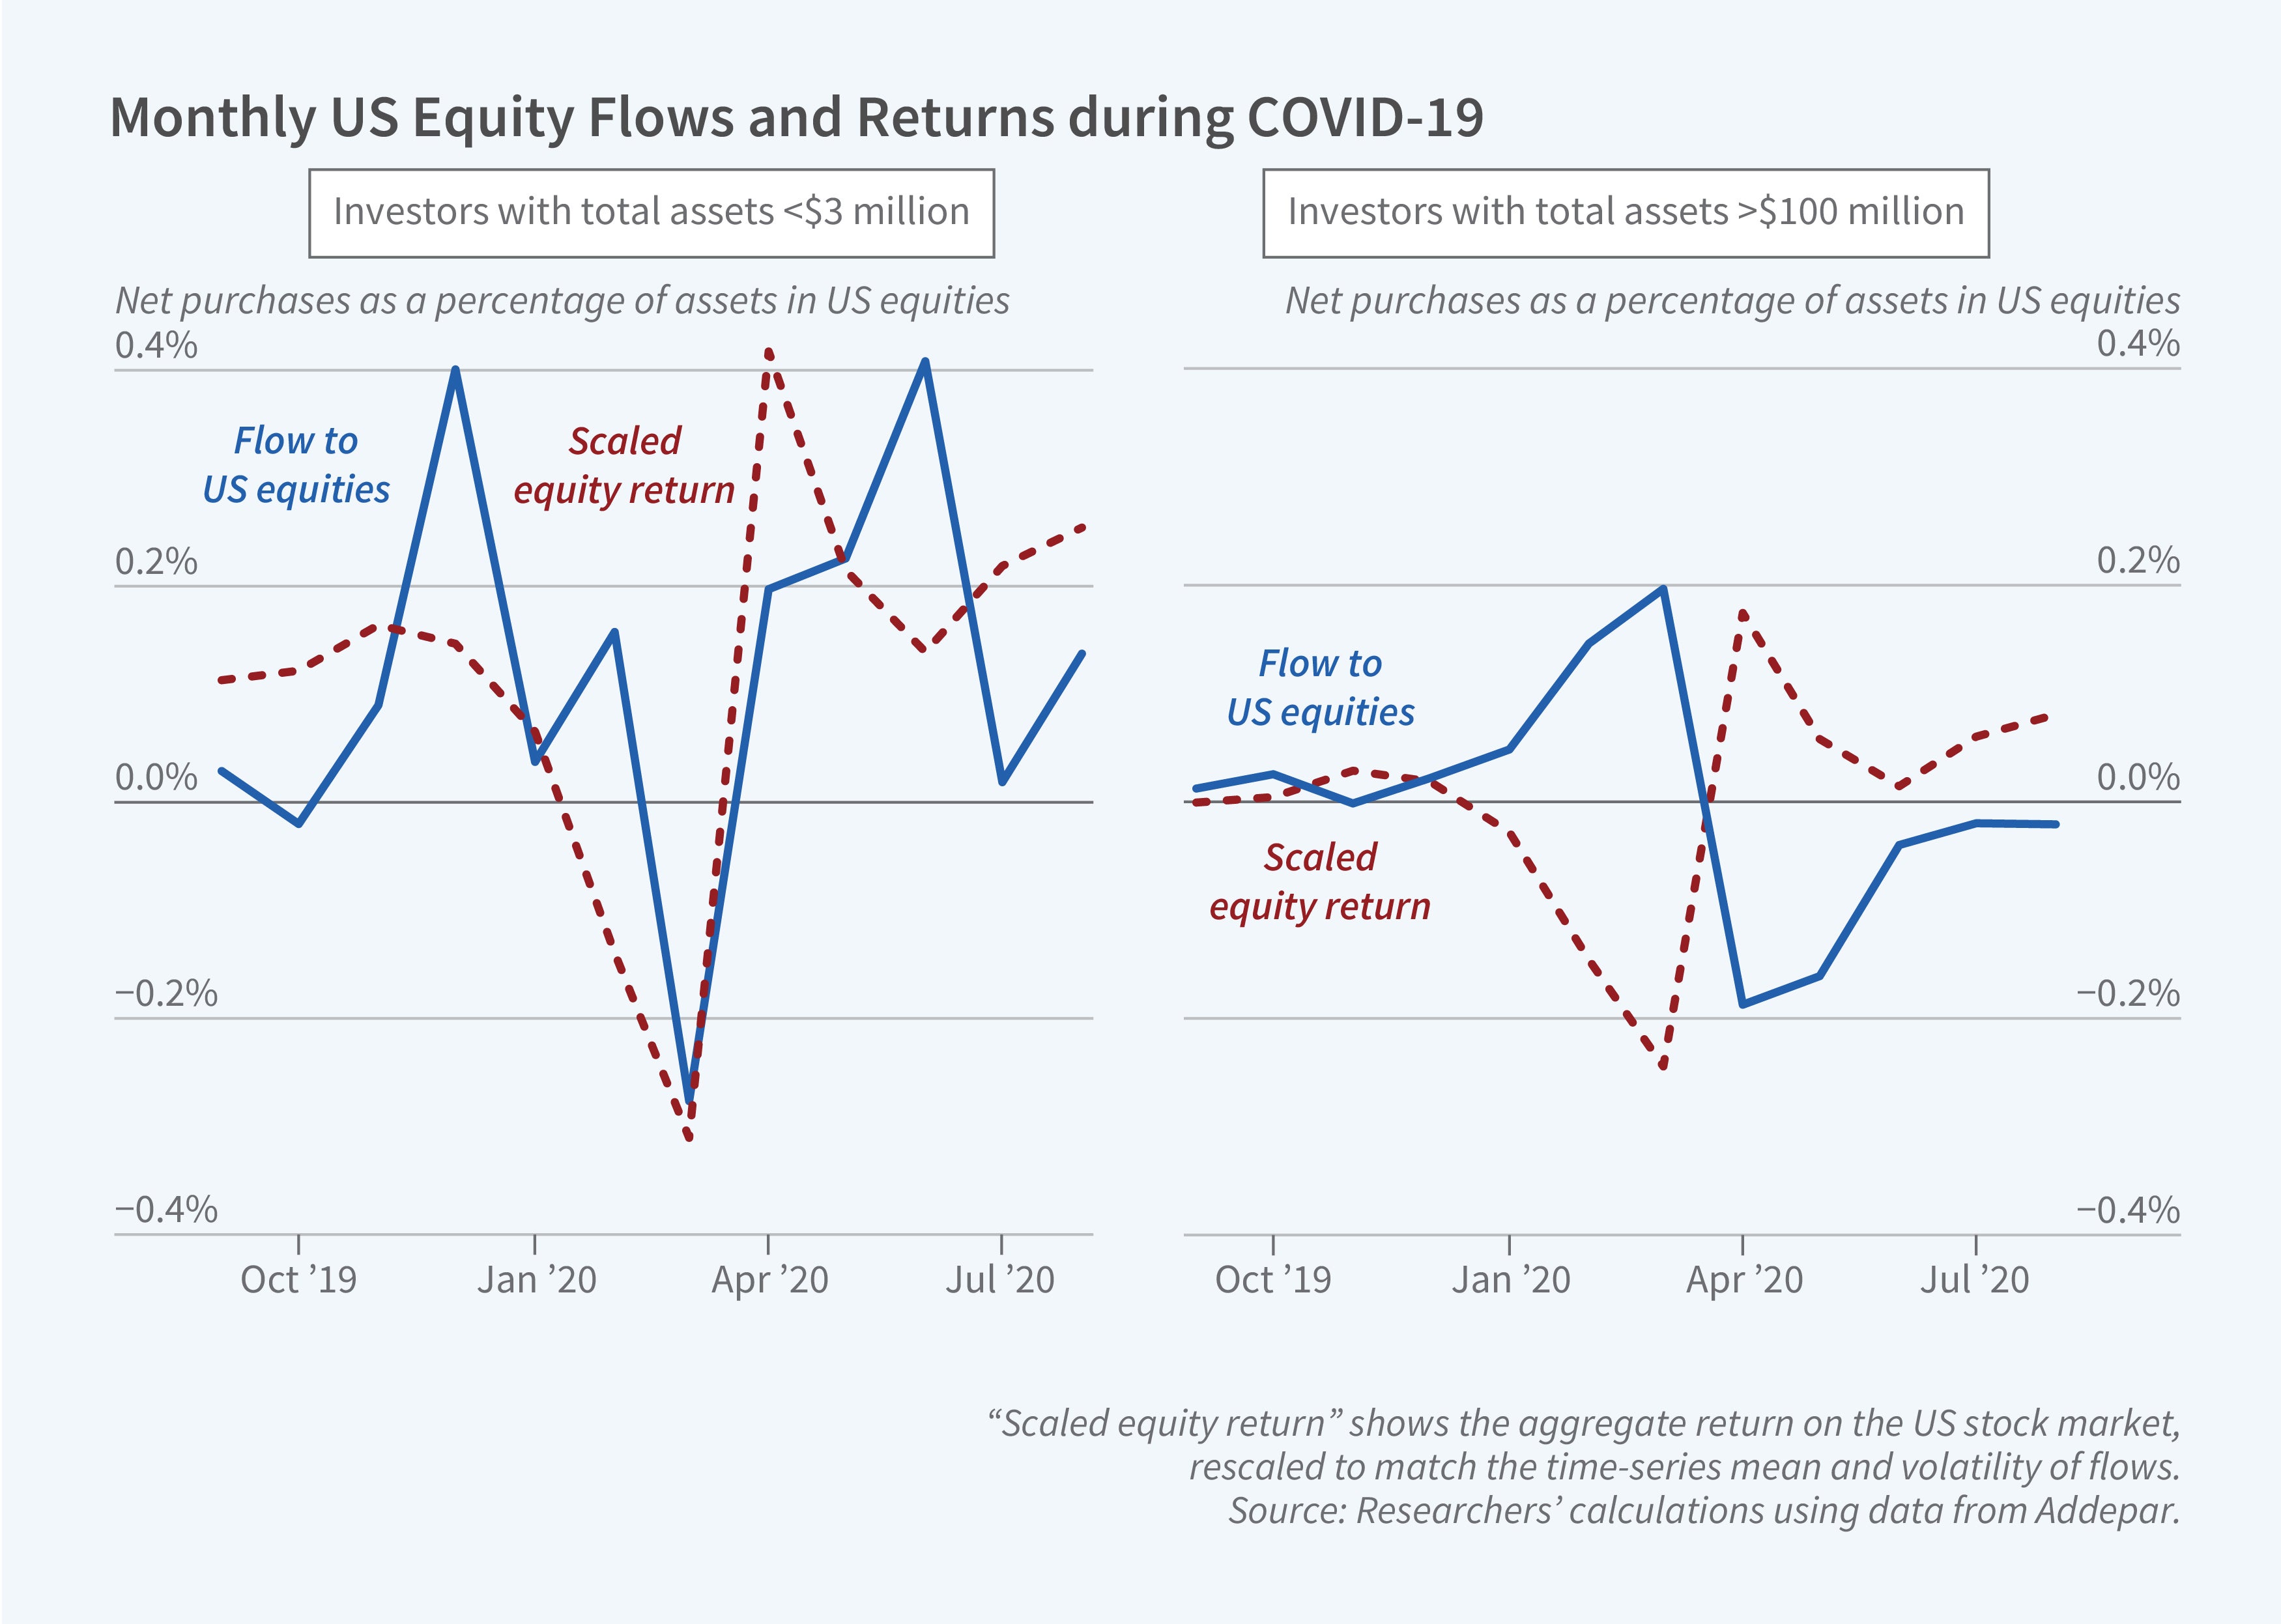
Data from the last decade show ultra-high-net-worth households bought equities during market declines while high-net-worth households sold.
The researchers present summary information on portfolio composition and the way it varies with investor net worth. The fraction of the household portfolio held in cash varied relatively little across the wealth distribution, while the portfolio share of municipal bonds increased with portfolio size and the fraction invested in corporate bonds and global equities declined.
For most investors in the dataset, portfolio flows to risky assets are positively correlated with returns, indicating procyclical investment decisions. For the typical investor in the dataset, a 10 percent rise in equity values was associated with a shift of about 0.1 percent of household portfolios toward equities. Disaggregating the investor population, however, revealed important heterogeneity in rebalancing behavior across the wealth distribution: UHNW households are countercyclical. Given the larger value of their portfolio holdings, when rebalancing patterns are weighted by portfolio value, the net effect of a rise in equity returns is an outflow from equity, albeit a small one. The researchers conclude that it is “unlikely to be an important stabilizing force.”
The researchers attempt to explain the factors that drive changes in household asset allocation patterns. They find that three factors that provide exposure to the long-term equity risk premium (defined as the difference between expected equity returns and long-term Treasury yields), the credit premium (the yield spread between corporate bonds and Treasuries), and the municipal bond premium (the gap between the yields on taxable fixed income securities and municipal bonds) explain approximately 81 percent of the variation in rebalancing across the 13 asset classes they consider.
— Linda Gorman
The researchers acknowledge the Ferrante Fund, the Center for Research in Security Prices at the University of Chicago and the Fama Research Fund at the University of Chicago Booth School of Business for financial support.


