|
|
|
|
|
House Price Gains and U.S. Household Spending from 2002 to 2006
"Homeowners borrowed $0.19 per $1 of home equity gains from 2002 to 2006 "
In House Price Gains and U.S. Household Spending from 2002 to 2006 (NBER Working Paper No.
20152), Atif Mian and Amir Sufi find that rising housing values promote spending, especially for low-income households, if refinancing provides "cash on hand." They also find that this spending has a significant impact on GDP.
The study finds that between 2002 and 2006, if one zip code experienced a rate of house price growth that was 20 percentage points greater than another, then it would also, on average, experience an annual rate of mortgage refinancing, with some cash withdrawn from the home, about three percent higher than the lower-appreciation zip code. This effect was seen almost entirely in zip codes where the average 2002 income was less than $50,000 per household. Among zip codes with average income more than $100,000, cash-out refinancing was almost zero.
This confirms the conventional view that lower cash-on-hand households most commonly tap their home equity when home values rise. But do they also spend that money? In terms of new car purchases, Mian and Sufi find that the general propensity to spend on new cars is $0.02 per dollar of home-value increase. But this effect is $0.03 for zip codes where households have an average 2002 income of $35,000 or less and zero for households living in zip codes in which the average income is $100,000 or more. The researchers also find evidence that in the years after the housing boom, low-income zip codes customarily experienced a dramatic reduction in both income and auto purchases.
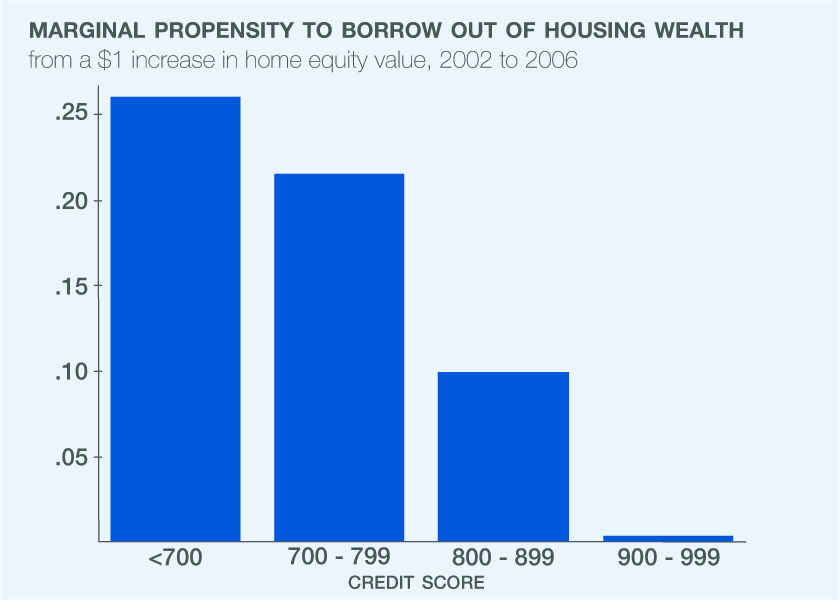
Mian and Sufi say the results illustrate why the level of wealth held by those who experience financial shocks can matter for the economy. They note that the total housing market decline of 2007 to 2009 was similar in magnitude to the crash in equity values in 2001. Yet the macroeconomic effects were very different because most stock market wealth is held by the high end of the wealth-distribution spectrum, where there is a very low marginal propensity to consume. Similarly, the house price recovery from 2011 onwards did not contribute as much to economic activity as the 2002 to 2006 housing gains. This was likely because the borrowing channel was effectively shut down for those most responsive to house price gains.
In short, low cash-on-hand households treated the rise in home values as a cash-on-hand shock. On average, homeowners borrowed $0.19 per $1 of home equity gains from 2002 to 2006. Furthermore, households living in low-income zip codes spent this extra cash. Mian and Sufi estimate that, under certain assumptions, rising home values raised aggregate consumer spending by 0.08 percent of GDP in 2003, 0.8 percent in 2004, and 1.3 percent in both 2005 and 2006.
-- Matt Nesvisky
|
|
Consequences of Legalizing Marijuana
"Legalization increased both marijuana use and marijuana abuse/dependence in people 21 or older."
Marijuana use is illegal under federal law. Despite this, an estimated 18 million people were current marijuana users in 2011. As of June 2014, 23 U.S. states had legalized the use of marijuana for medical purposes in response to growing awareness that the active ingredient in the drug may be useful as an analgesic for chronic pain, an antiemetic, and an antispasmodic. Two states, Washington and Colorado, had legalized recreational use as well.
In The Effect of Medical Marijuana Laws on Marijuana, Alcohol, and Hard Drug Use (NBER Working Paper No. 20085),
Hefei Wen,
Jason M. Hockenberry, and
Janet R. Cummings use individual survey data from seven states to examine the effect of legalizing medical marijuana. They find that legalization increased both marijuana use and marijuana abuse/dependence in people 21 or older. It was also associated with an increase in adult binge drinking, defined as the number of days on which an individual had five or more drinks on the same occasion in the last month. People 12 to 20 years old were 5 to 6 percent more likely to try marijuana for the first time when medical use was legalized. Legalization was not associated with an increase in adolescent drinking, or with increased cocaine or heroin use in either group.
The data are drawn from the 2004 to 2011 National Survey on Drug Use and Health. The survey data include self-reported information on respondent drug use, the frequency of use, and questions designed to assess drug abuse or dependence with respect to criteria in the Diagnostic and Statistical Manual of Mental Disorders, 4th edition. The authors controlled for age, gender, race/ethnicity, cigarette smoking, urban residence, family income, marital status, educational attainment, college enrollment, and employment status. They also controlled for state beer taxes, unemployment rates, average personal income, and median household income.

The survey data do not distinguish between legal medicinal and illegal recreational use. In practice, many state laws are vague about the medical conditions that qualify for legal medical use. "Chronic pain" is not medically verifiable, and the authors explain that allowing people with chronic pain to qualify for medical use makes it difficult to separate medical users from recreational users posing as medical users.
For adults, the baseline predicted probability of an individual having used marijuana in the last month was 8.6 percent. Legalization increased it by 1.37 to 1.40, an increase of 16 percent. The number of marijuana use days per month rose by 0.14 to 0.21 days a month, or 12 to 17 percent. Legalization increased the probability of adolescent initiation of marijuana use in the last year by 0.32 to 0.46 percent, a 5 to 6 percent increase. While this suggests that more adolescents experimented with marijuana, the data do not suggest that regular use increased in this group.
The authors note that the 6 to 9 percent increase in frequency of adult binge drinking, along with an estimated increase in the probability of simultaneous use of marijuana and alcohol of 15 to 22 percent, suggests that legalization could result in "considerable economic and social costs from downstream health care expenditures and productivity loss."
-- Linda Gorman
|
|
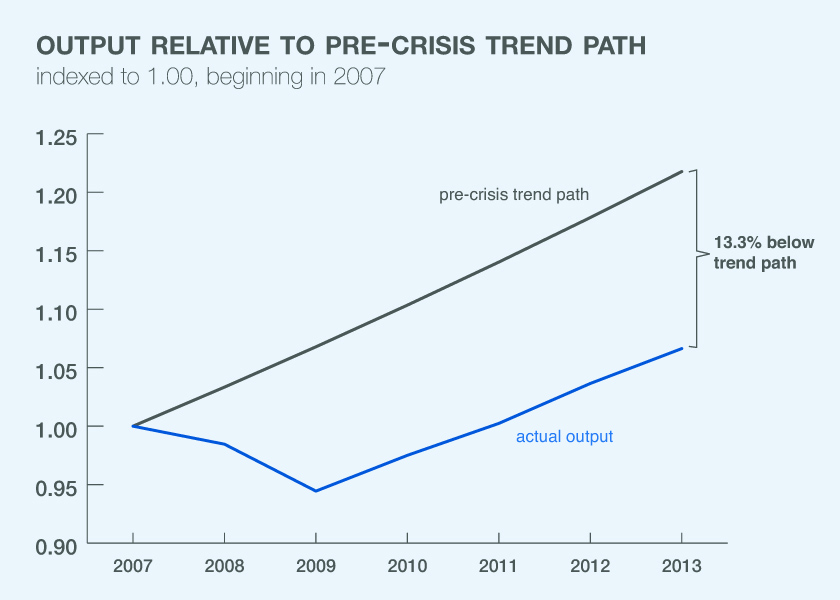
Longer-Term Consequences of the Financial Crisis
"Analysis suggests that out of the 13 point output shortfall, the largest contributor was the depletion of the stock of plant and equipment, which accounted for 3.9 percentage points."
The financial crisis that began in 2008, and the ensuing Great Recession, cost the U.S. a substantial amount of output. In 2013, output was 13 percent below its trend path from 1990 through 2007. In Quantifying the Lasting Harm to the U.S. Economy from the Financial Crisis (NBER Working Paper No. 20183),
Robert E. Hall starts from the widely accepted proposition that the financial crisis was the cause of the collapse in product and labor demand. He offers a complementary analysis of other aspects of the post-crisis economy, focusing on the durable effects of the crisis that a boost in product demand would not correct quickly. These effects are lost total factor productivity, lost investment resulting in a lower capital stock, and low labor-force participation lingering after job-creation incentives have returned to normal.
The analysis suggests that out of the 13 point output shortfall, the largest contributor was the depletion of the stock of plant and equipment, which accounted for 3.9 percentage points. . The second largest was a shortfall of 3.5 percentage points in total factor productivity. The third was a shortfall of 2.4 percentage points in labor-force participation. Just 2.2 percentage points was the result of lingering slackness in the labor market in the form of abnormal unemployment and substandard weekly hours of work.
Hall observes that while the capital stock is responsible for the largest part of the output shortfall, it cannot respond immediately to a boost to product demand. He suggests that a boost in demand would probably trigger an accelerator response that would close some part of the shortfall in capital. In the longer run, the strong mean reversion in the historical capital/output ratio should work to close the entire gap.
Unemployment has fallen slowly during the recovery, reaching 1.3 percentage points above normal in 2013, and contributing 0.9 percentage points to the shortfall in output in that year. The return to normal has been slower than in previous post-recession episodes because the crisis shifted the composition of jobseekers toward those with low job-finding rates. People who lost jobs without hope of returning to the lost job are the most important group with long spells of unemployment. Mean reversion of unemployment is a well-established feature of the U.S. economy and there seems little reason to think that the crisis would affect the unemployment rate in any highly persistent way.
Labor-force participation fell substantially after the crisis, contributing 2.5 percentage points to the shortfall in output. The decline showed no sign of reverting as of 2013. The author believes that part of the participation decline is demographic and part reflects low job-finding rates, which had returned to close to normal in 2013. But an important part may be related to the large growth in beneficiaries of disability and food-stamp programs. Bulges in their enrollments appear to be persistent. Both programs place high taxes on earnings and so discourage labor-force participation among beneficiaries.
-- Les Picker
|
|
Discount Rates for the Very Long Run
"Households apply annual discount rates just under 2.6 percent to payments to be made more than a century into the future."
One of the more daunting tasks for policymakers and investors is to identify appropriate discount rates to trade-off the short-term costs and long-term benefits of their actions. In Very Long-Run Discount Rates (NBER Working Paper No. 20133)
Stefano Giglio,
Matteo Maggiori, and
Johannes Stroebel approach this challenge by exploiting a unique feature of housing markets in the United Kingdom and Singapore, where they find that investors pay less for long-term leases of residential real estate than they do for otherwise identical perpetual ownership contracts. The authors show that these discounts are indicative of low discount rates for very long-term cash flows.
The housing markets in the United Kingdom and Singapore use two types of transactions for the acquisition of real estate, approaches that can differ significantly from how property is bought and sold elsewhere. One is "leaseholds," or temporary, pre-paid, and tradable ownership contracts with maturities between 99 and 999 years. The other is "freeholds," which are perpetual ownership contracts similar to the free-and-clear types of transactions used in many other countries. The existence of these two types of transactions, side by side within individual markets, allows the authors to compare how investors and agents interact in assessing short-term and long-term risks, the values of assets and other factors associated with real estate.
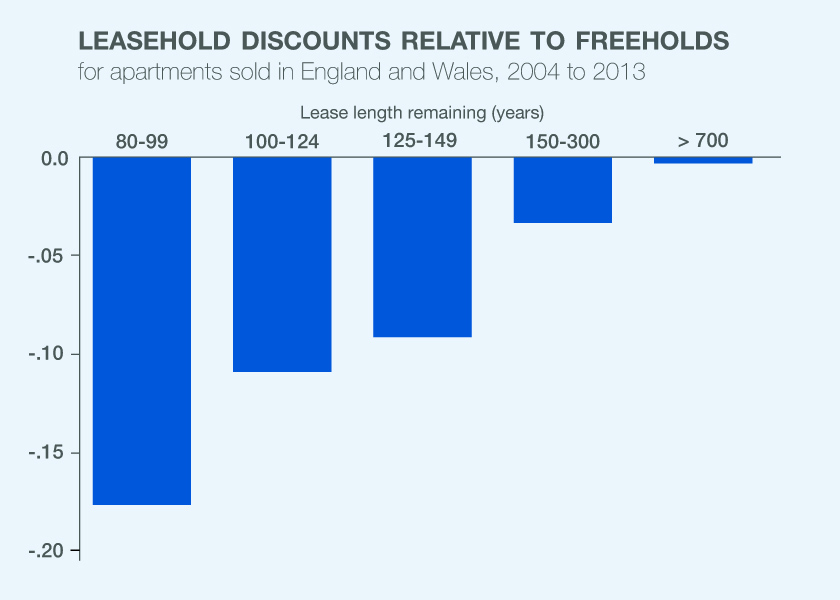
In the U.K, the authors relied upon data from 8 million real estate transactions for the years 2004 through 2013. For each sale, they observe many property characteristics such as home size and location. In Singapore, the authors looked at housing data for 380,000 transactions between 1995 and 2013.
Comparing results from the two types of transactions, the authors find low long-run discount rates associated with cash flows stretching 100 years or more into the future. In essence, parties to transactions assign significant present values to those cash flows. For both the U.K. and Singapore, the authors found that 100-year leaseholds were valued 10 to 15 percent less than freehold contracts, while leaseholds with maturity dates of 125 to 150 years were valued 5 to 8 percent less than freeholds. The authors found no price differences between freeholds and leaseholds with maturity dates of more than 700 years. The results suggest that households apply annual discount rates just under 2.6 percent to payments to be made more than a century into the future.
While the overall results have direct relevance to how real estate and other assets are valued and traded, the authors say the findings also may be of importance in other fields, such as environmental economics. The authors note that the issues of short-term costs versus long-term benefits of reducing carbon pollutants now dominate debates over climate-change policies.
-- Jay Fitzgerald
|
|
Wage and Employment Effects of Foreign STEM Workers
"Growth of foreign STEM workers by one percentage point of total employment increases growth in the wages of native college educated workers by 7 to8 percentage points."
The effect of immigration on the wages and employment of native workers is a topic of perennial debate. According to Foreign STEM Workers and Native Wages and Employment in U.S. Cities (NBER Working Paper No. 20093), extending visas to more STEM workers increases the wages of native workers and does not affect the employment of other groups, although it does raise housing costs for college-educated workers.
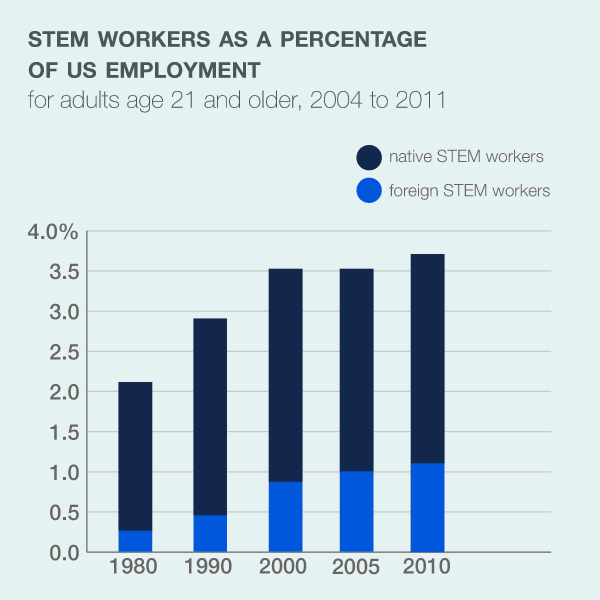
"[A] rise in the growth of foreign STEM [workers] by one percentage point of total employment increases growth in the wages of native college educated workers by a statistically significant 7-8 percentage points," write authors Giovanni Peri,
Kevin Shih, and
Chad Sparber. "The same change had a smaller but usually statistically significant effect on the wages of native non-college educated workers equal to 3-4 percentage points.... The increased cost in non-tradable services (housing) absorbed about half of the increase in the purchasing power of college educated wages."
The study concentrates on foreign workers in order to determine whether the increase in STEM workers causes wages to rise or whether other factors are at work. The authors compare the share of foreign STEM workers in each of the 219 metropolitan areas in 1980 with changes starting in 1990, when the government initiated the H-1B visa program, the main channel of entry of foreign STEM workers. By doing so, the authors are able to isolate a supply-driven change in STEM workers that is likely exogenous to other factors that might affect wages, employment, and productivity across cities.
These foreign workers - unlike their innovations - did not spread evenly across the country. y were concentrated in certain cities in 1980, before the H-1B program, and the H-1B visa-holders tended to flow to those cities as well. This disparity among cities allows the authors to compare the local rise in wages, which boosts the wages even of native non-college graduates, although the effect is about half of what it is for native college graduates.
The authors also find that STEM workers have an effect on total factor productivity and
skill-biased productivity: "...inflows of foreign STEM workers may explain between 30 and 50% of the aggregate productivity growth and 4 to 8% of the skill bias growth that took place in the U.S. between 1990 and 2010."
-- Laurent Belsie
|
|
How Do Health Care Providers Respond to Public Health Insurance Expansions?
"Dentists increase the supply of visits they provide and their practices serve a greater number of Medicaid-covered patients."
Medicaid is a government health insurance program that has historically enrolled children, pregnant women, and people with serious medical problems from low-income households. Private providers' services are paid for by state and federal governments. Individual states have the option to enroll able-bodied adults at various income levels, and have some flexibility in choosing the benefits available to them.
Between 1999 and 2011, three U.S. states added adult dental coverage to their Medicaid programs, six states dropped it, and three states did both. In How Do Providers Respond to Public Health Insurance Expansions? Evidence from Adult Medicaid Dental Benefits (NBER Working Paper No. 20053),
Thomas C. Buchmueller,
Sarah Miller, and
Marko Vujicic explore state changes in Medicaid dental coverage to examine how dental practices responded to coverage expansions. They find that when publicly-provided dental insurance expands, dentists increase the supply of visits they provide and their practices serve a greater number of Medicaid-covered patients. The dentists increased their own working time by about a half-hour a week, and increased the supply of patient visits provided by employing more dental hygienists. Waiting times for appointments increased by almost a day in states in which dental hygienists were not allowed to bill Medicaid directly; they did not increase in states in which hygienists could bill directly.
Of the dental practices studied, 39 percent saw publicly insured patients. Visits by publicly-insured patients increased by about three per week, an increase of about nine percent; there was no significant change in visits by privately insured patients. Emergency or walk-in visits went up by about 0.5 visits per week, also an increase of 9 percent. About 67 percent of practices employed hygienists, and visits to them increased by 9 to 12 percent, about 4.5 to 6.1 visits per week. In high-poverty counties, the increase in walk-in visits was 5 times larger and the increase in use of dental hygienists was 2.5 times higher. Even after adjusting for the fact that hygienists may see patients from more than one dentist, the authors conclude that "making greater use of hygienists is an important part of how dentists meet the new demand created by the Medicaid policy changes."
-- Linda Gorman
|
|
|
|
 |
|
|
|
If you wish to unsubscribe from this email, please click here
Questions or problems with this email please contact: info@nber.org |
|
|
| The Digest is not copyrighted and may be reproduced freely with appropriate attribution of source. |
|